Monthly Archives: April 2013

Gasoline Prices in Europe by Country

According to Russian news agency Ria Novosti, Norway has the highest gasoline price among European countries, with a price of 1.90 Euro per liter ( or US $9.475 per gallon at the current exchange rate of 1 Euro = US $1.31). Norway is followed by Italy, Netherlands, Sweden, and Greece.

The lowest gasoline prices are found in Belarus and Kazakhstan, 0.68 Euros and 0.70 Euros per liter, respectively. The average gasoline price for European nations is 1.39 Euros per liter.


Alcohol Consumption Per Capita by Country

Alcohol consumption per capita by country

According to the the World Health Organization (WHO), alcohol consumption by adults on a per-capita basis is highest primarily in Eastern Europe. The Global Status Status Report on Alcohol and Health ranks Moldova, Hungary, and Russia at the top of the list. In Moldova, adults consume 18.22 liters of alcohol per year through a combination of beer, wine and spirits. How much alcohol is consumed in your country?

GDP Growth by Country for 2013

This chart by The Economist shows the latest forecast from the International Monetary Fund (IMF) for economic growth prospects worldwide.

Emerging economies such as China, Peru, Paraguay and several African nations, will enjoy GDP growth rates of 6% or higher. In contrast, several developed economies such as the United States, Canada, and several countries in Western and Southern Europe will experience GDP growth rates of 2% or lower, and in many cases even negative.


Terrorist Attacks in the U.S. Since 1970

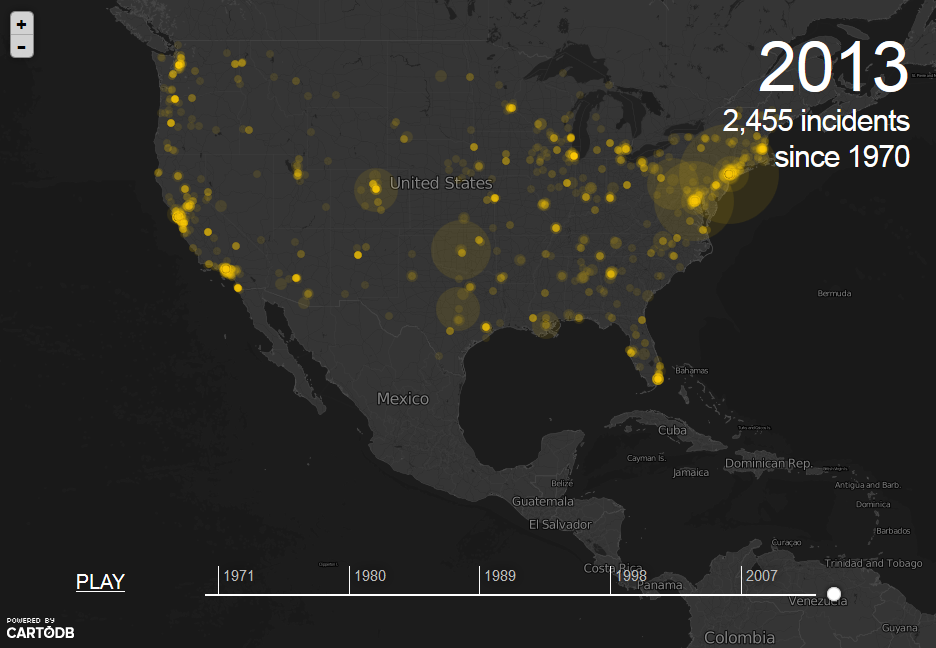
The Guardian has published this interactive map pinpointing the location of terrorist attacks in the United States since 1970.

A total of 2,455 incidents have occurred between 1970 and 2011. Most of the attacks have happened in the Northeast, and the largest number of casualties is also concentrated in that region (large-size circles).

Source: The Guardian: Data Blog – Four decades of US terror attacks listed and detailed


Number of Nuclear Tests Since 1945

North Korea conducted its third nuclear test on February, 2013. Two nuclear test preceded this one, the first in 2006, and the second in 2009.

However, the nation that has performed the largest number of nuclear tests since 1945 is the United States, a total of 1,032. In the same period, the USSR/Russia performed a total of 715 nuclear tests, and France performed a total of 210 nuclear tests.

Source: Statista: North Korea Conducts Third Nuclear Test


Total Carbon Emissions by Country

The Kyoto Protocol is an international treaty that seeks the reduction of greenhouse gases that contribute to global warming by setting emission reduction targets for industrialized nations. The Kyoto Protocol was signed on December 11, 1997 in Kyoto (Japan) by 191 countries. The United Stated signed the treaty, but later it did not ratify it.

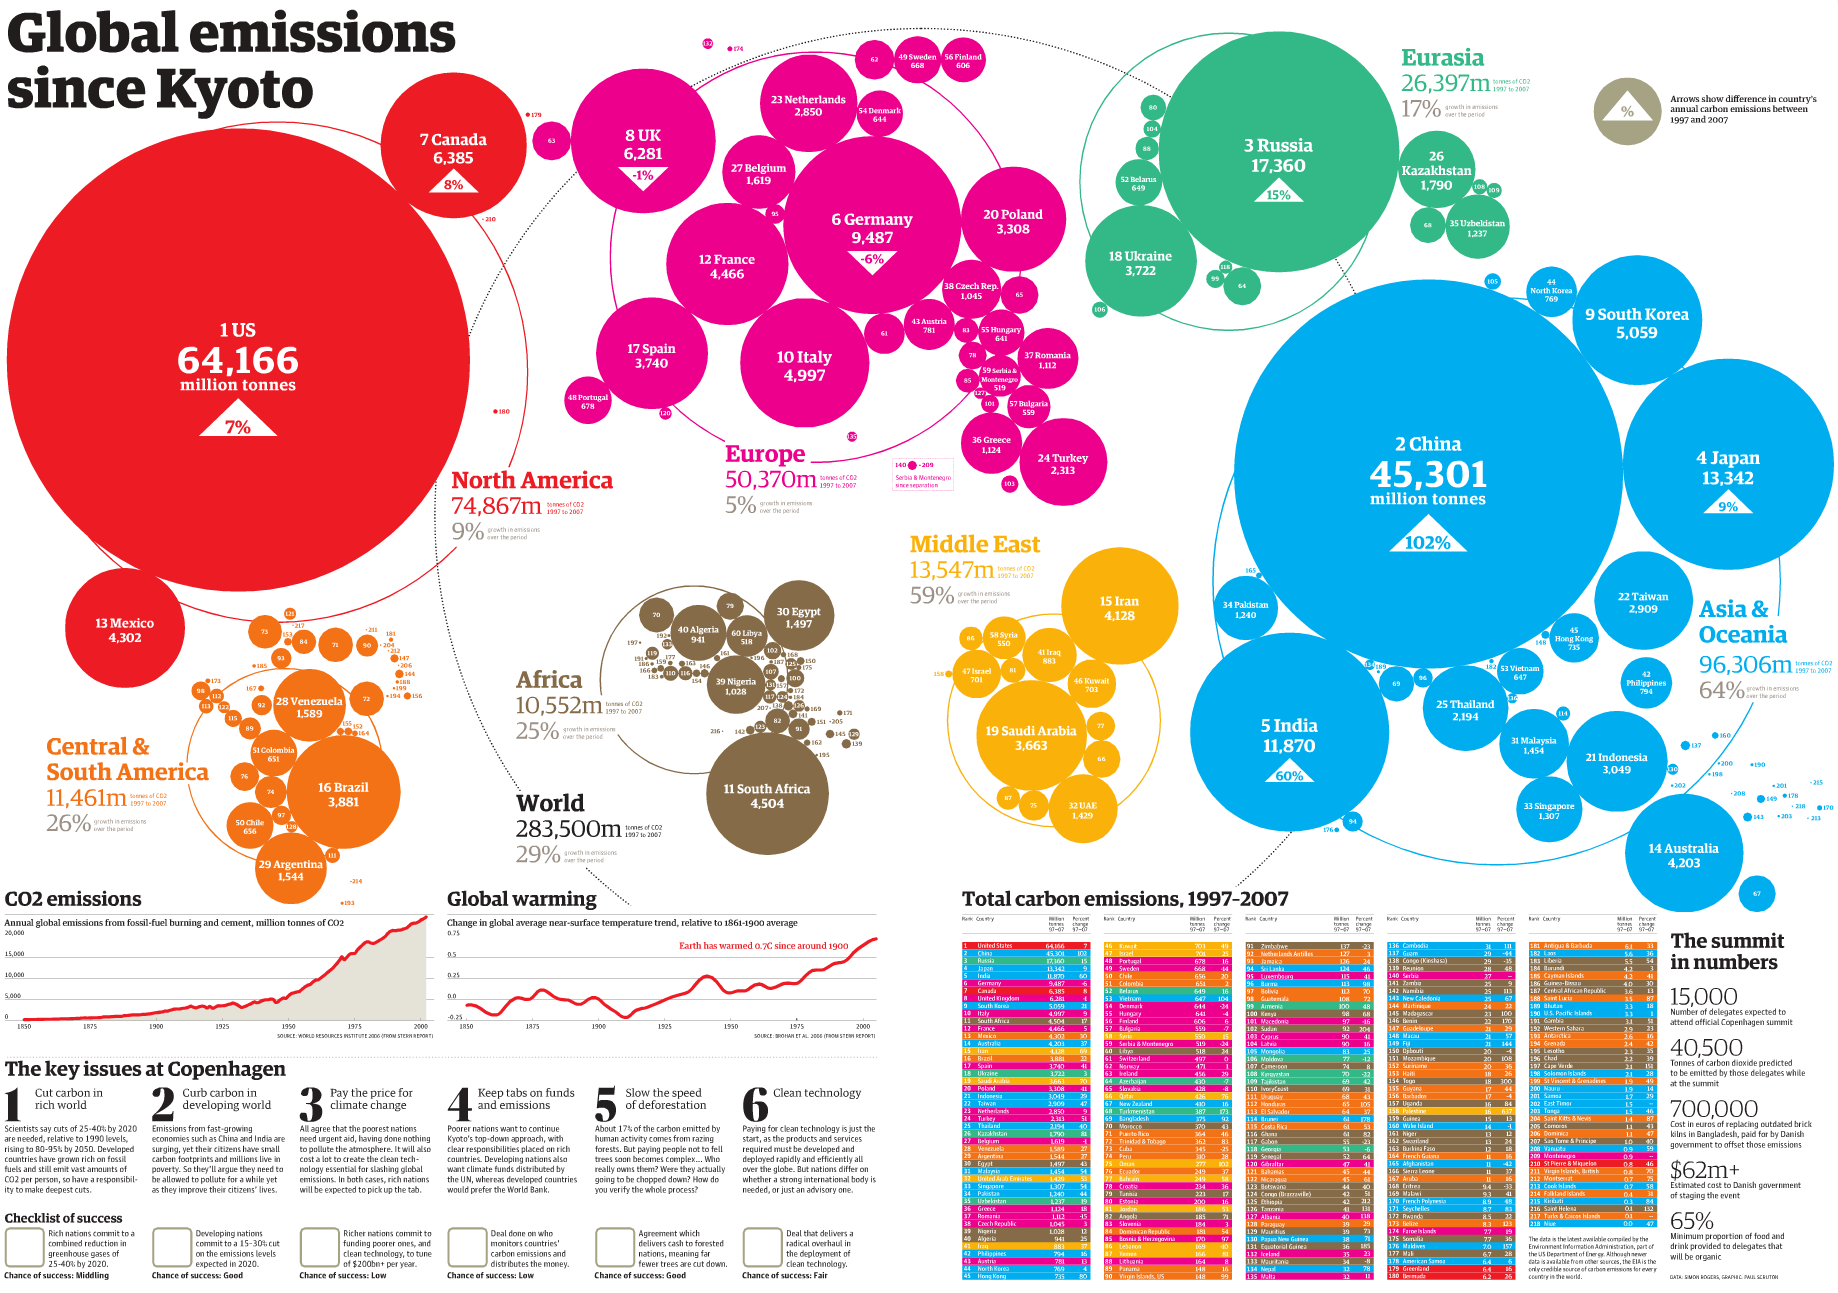
This visualization by The Guardian shows total carbon emissions by country between 1997 and 2007, ten years since the protocol was signed.

The United States is the country that has produced the largest amount of carbon emissions (64,166 million tonnes) in the period 1997-2007 followed by China, Russia, Japan, India, and Germany.

Asia and Oceania combined are the regions with the highest carbon emissions produced in the same period (96,306 million tonnes). Asia and Oceania are followed by North America (U.S., Canada, and Mexico) with carbon emissions of the order of 74,867 million tonnes, and Europe with carbon emissions at 50,370 million tonnes as of 2007.


World Internet Users by Region

Of the 7 billion people in the world, only 2.4 billion are connected to the Internet, that is roughly 34% of the population as of 2012.

Internet penetration is the highest in North America (79%), followed by Oceania (68%), Europe (63%), and Latin America (43%).

Source: Statista: Only a Third of the World’s Population Is Online


Internet Connectivity in the United States

As part of the PBS series America Revealed, this aerial visualization shows the patterns of internet distribution in the United States. We can see that the regions with highest levels of internet connectivity include the Northeast, and parts of the South and Midwest, followed by the Pacific West.

For additional interesting aerial visualizations, such as the distribution of the unemployed, electricity network routes, public transportation paths, U.S. imports and exports of beef patterns, the distribution of the population in towns and cities, etc., visit: The Roosevelt’s – Aerial Data Visualisation Reveals Life In The United States.

Download Speed by Country

Ranking of countries by download speed

For anyone who spends a significant part of their day working online, there is nothing more frustrating than having to use a slow internet connection. There are countries where slow internet connections are a thing of the past though, as shown by the household download index compiled by Ookla using data from Speedtest.net. According to the latest data, the countries with the fastest residential internet are Hong Kong, Singapore, and Lithuania. In Hong Kong, the average download speed is now a blistering 44.06 Mbps. Contrast that speed with the download speed in the countries with the slowest residential internet, namely Botswana, Uzbekistan, and Benin, where download speeds do not exceed 1 Mbps. How fast is your internet connection? You can check it using the meter at Speedtest.net

Death Sentences and Executions by Country

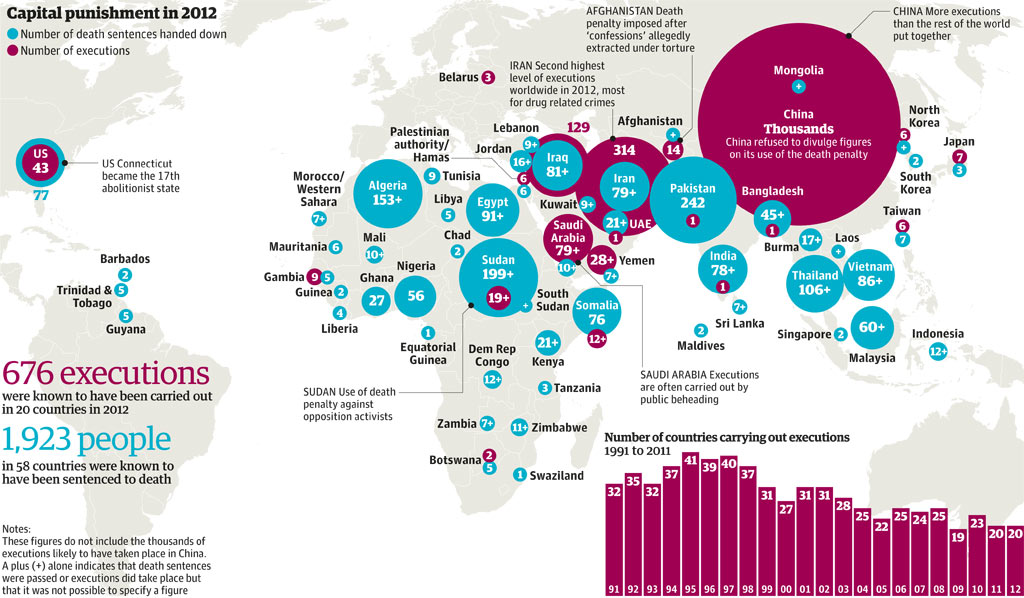
In this visualization by The Guardian, based on data from Amnesty International, we can see which countries still use the death penalty.

In 2012, 1,923 people were handed out a death sentence in 58 countries, and 976 executions were carried out in 20 countries.

China is by far the country that has carried out the largest number of executions, more than the rest of the world combined. Numbers are not know, though, since China keeps that information secret. China is followed by Iran, Iraq, Saudi Arabia, Kuwait, the United States, Yemen, Sudan, and Somalia.