Category Archives: Charts

Key Commodities and Emerging Markets

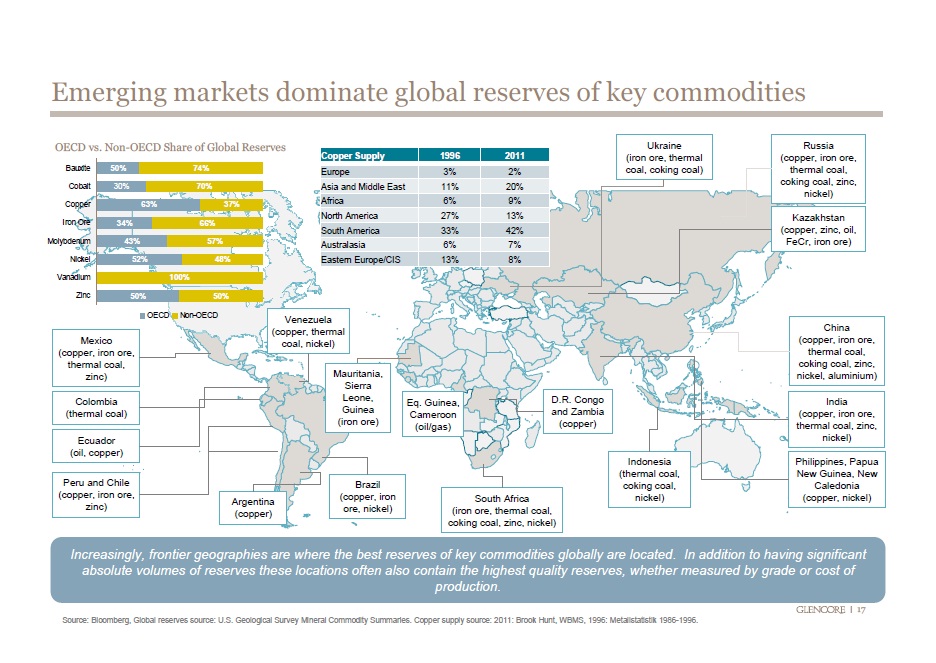
emerging market dominate commoditiesCommodities are raw materials essential for the production of more complex products. Commodities fall into three large categories: agricultural, energy, and metals.

According to this visualization, emerging economies (Brazil, Russia, India Indonesia, China, South Africa, etc.) have the largest reserves of certain key energy and metal commodities such as oil, coal, copper, cobalt, iron ore, molybdenum, nickel, zinc, and aluminum.

Source: Business Insider: 36 Maps That Explain The Entire World


Gasoline Spending by State in the U.S.

gas guzzlers mint finalMint.com tracked how much its users spend on gasoline in one month, and how many times they visit the pump in the same period across the United States.

On average, Americans spend $177 on gas in single month, making an average of 6 visits to the pump, and spending an average of $32 in each transaction.

San Jose (California) stands out as the city where Mint users spend the most on gas, an average of $216 in a single month. Other cities where Mint users spend a lot on gas include Birmingham (Alabama), Jacksonville (Florida), Phoenix (Arizona), and Charlotte (North Carolina) to name a few. In contrast, in cities like New York, Brooklyn (New York), and Washington D.C., which have a good public transportation system, the gas bill is between $102 and $112 per month.

Source: Mint: Gas Guzzlers


Percentage of the Population Living on $2 or Less a Day

surviving on a few dollars per day worldMIT economists Abhijit V. Banerjee and Esther Duflo, conducted surveys in developing nations to see which countries survive on a few dollars per day. The cities or countries where people are known to live on meager dollar amounts on a daily bases are not that surprising, but the percentage of the population living under these conditions is.

In Udaipur and Hyderabad (India) a staggering 94% of the population survive on $2 or less per day. In Bangladesh, 69.4% go on $2 or less per day. In Ghana, 67.7% survive on $2 or less per day. In Guatemala, 64.8% of the population survive on $2 or less per day.

Source: GOOD: Living on Less


Women in the Workforce by Country

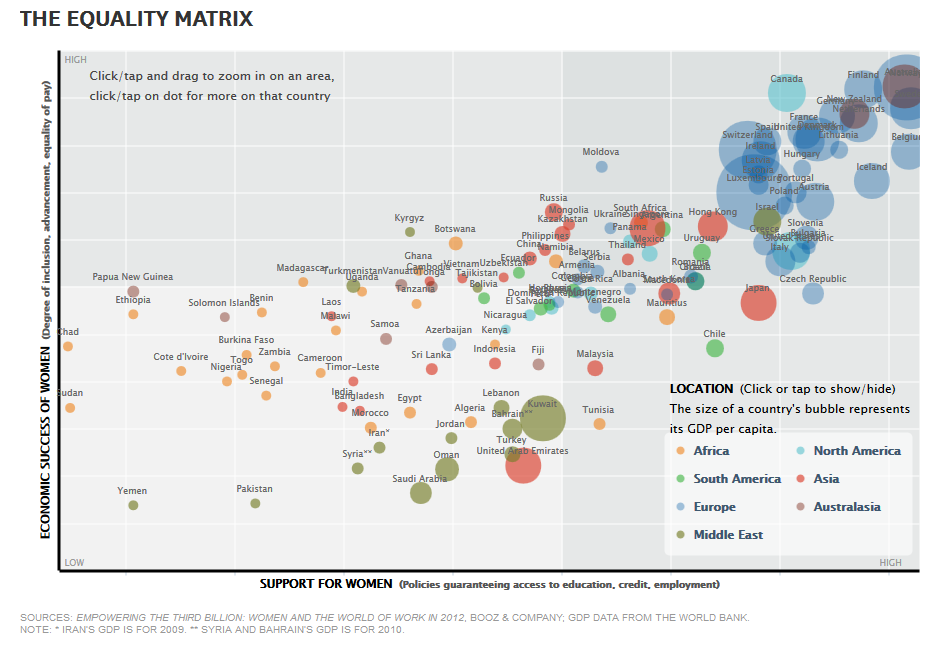
women and equality worldIt has been said, that if women participated in the workforce more actively, like their male counterparts, the Gross Domestic Product (GDP) of those countries would be higher.

However, most countries, including some developed nations do not have policies in place that support women’s participation in the workforce, such as access to education, credit, employment, paid maternity leave or child care.

Countries with the highest economic success for women (measured in terms of equality of pay, degree of inclusion in the workforce, and career advancement), that offer the best policies for supporting women in the workforce include Norway, Australia, Sweden, Finland, Germany, Belgium, and Iceland.

Countries with the lowest degree of economic success that have few policies (or none) that support women in the workplace include Chad, Sudan, Yemen, Pakistan, Syria, Saudi Arabia, among others.

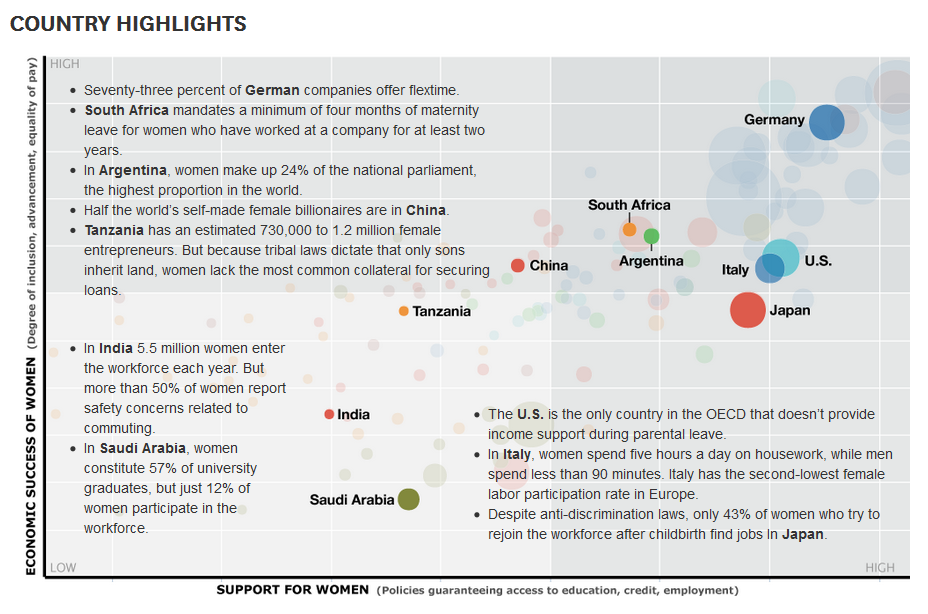
women and equality world 2Some interesting facts about the success of women in the workplace and the policies in place to support them in certain countries can be seen in the graphic above.

Source: Harvard Business Review: Vision Statement: Women and the Economics of Equality


Gun Shops in America

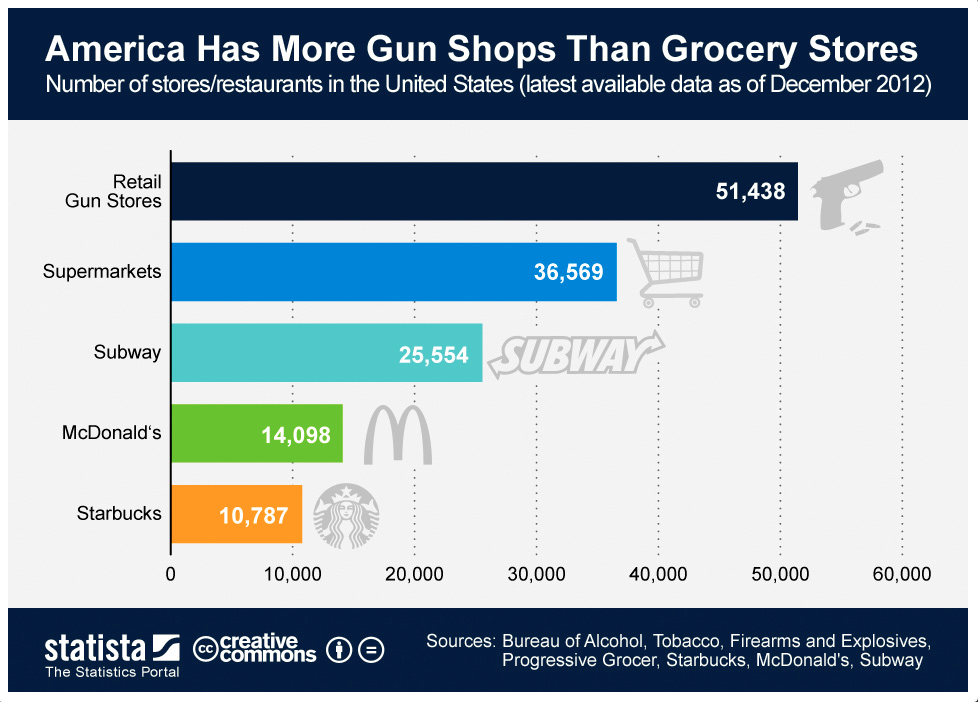
more gun shops thank grocery storesAccording to Statista.com, gun shops in the United States outnumber supermarkets, fast food restaurants, and coffee shops.

With a total of 51,438 outlets as of 2012, the number of gun shops in the U.S. is larger than the number of stores of Starbucks, McDonald’s, and Subway combined (a total of 50,439 stores).


Number of Nuclear Tests Since 1945

North Korea conducted its third nuclear test on February, 2013. Two nuclear test preceded this one, the first in 2006, and the second in 2009.

However, the nation that has performed the largest number of nuclear tests since 1945 is the United States, a total of 1,032. In the same period, the USSR/Russia performed a total of 715 nuclear tests, and France performed a total of 210 nuclear tests.

Source: Statista: North Korea Conducts Third Nuclear Test


Body Mass Index (BMI) by Country

A body mass index (BMI) between 18.5 and 24.9 is usually considered a healthy body weight to height relationship. A BMI of 25 or higher indicates body weight not optimal for the height of a particular person.

This visualization published by Visual.ly, shows the different BMI values for adult men and women across the globe.

Countries with a healthy average BMI between 20 and 22.9 include several nations in Africa, Yemen, India, Thailand, Japan, Pakistan, Singapore, among others.

Countries with an average BMI between 23 and 24.9 include several Asian nations, several European nations (including France), some nations in Africa, and Honduras.

Countries with an average BMI between 25 and 26.9 include Canada, Russia, Costa Rica, Colombia, Israel, Austria, Switzerland, Brazil, all Nordic countries, Spain, Portugal, and nations in the Middle East.

Countries with an average BMI of 27 and over  (the highest BMI range) include the United States, Kuwait, Cuba, Argentina, Chile, Bolivia, Peru, Venezuela, Australia, UK, New Zealand, Greece, and Germany to name a few.
 

The Influenza Virus Visualized

Humans can be infected by influenza viruses types A,B, and C. Type A affects humans, birds, and pigs. Type B and C affect only humans. Type C is less severe than type A and it does not cause pandemics.

In this visualization by Information is Beautiful, we can see how the different strains of influenza virus affect humans, what is their origin, and how they are transmitted from pigs and from birds ultimately to humans.

Type A influenza is divided into H and N strains. The “swine flu” N1H1 killed 15,000 people worldwide in 2009-2010. The “bird flu” H5N1 strain, with a fatality rate of 60%, has killed 371 people as of 2013. The more recent H7N9 strain has killed thousand of pigs in China, with 8 human fatalities to date.


North Korea vs. South Korea

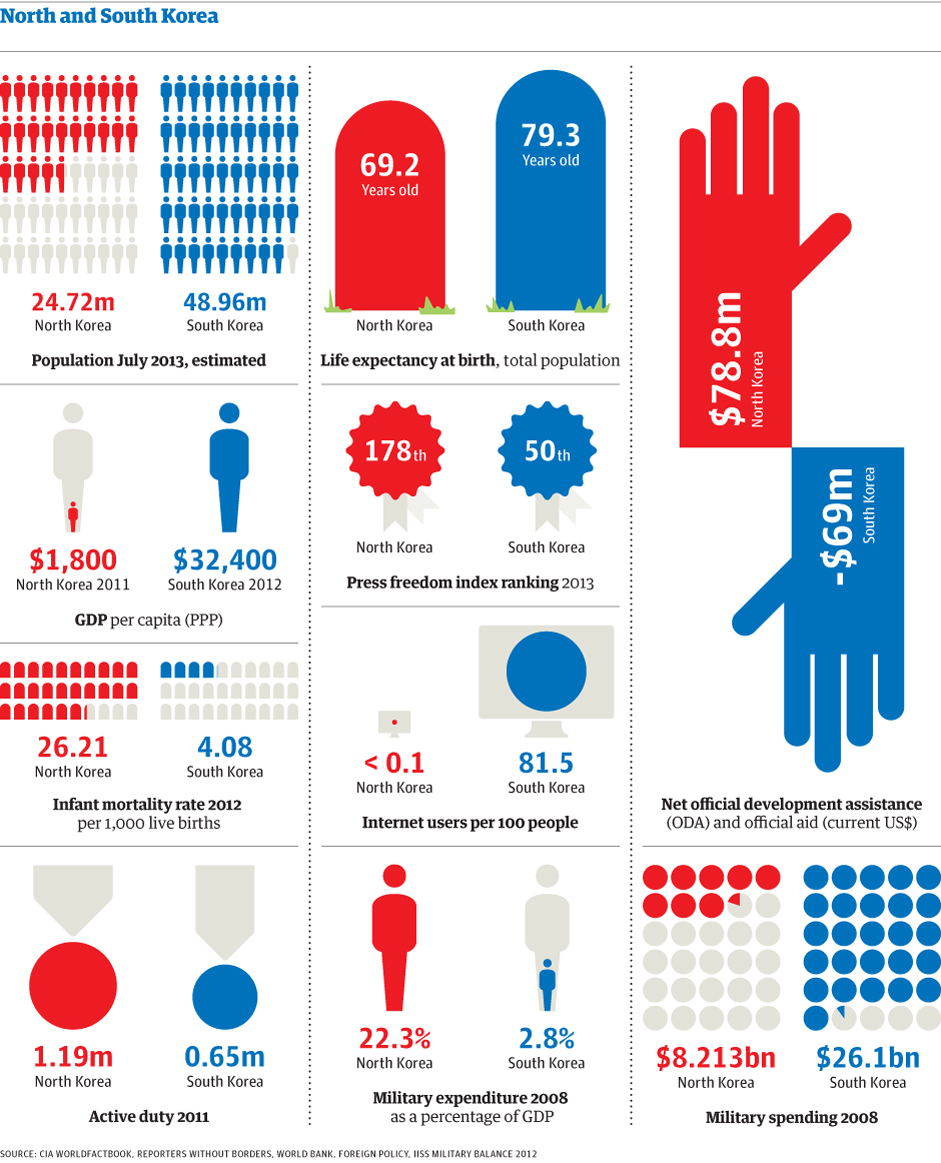
In this visualization created by The Guardian, we can see how North Korea compares to South Korea in terms of population, Gross Domestic Product (GDP), life expectancy, freedom of the press, military spending, internet connectivity, infant mortality, among other indicators.

North Korea is a poor country with half the population of South Korea. It is one of the worst countries in terms of corruption and freedom of the press. Its military spending constitutes approximately 22.3% of its GDP, compared to 2.8% for South Korea.

Additional resource: IndexMundi: South Korea vs. North Korea – Country Comparisons


Number of Deaths in World War II

This visualization found in Wikimedia.org, shows World War II casualties per country by number and percentage of population, as well as the percentage of military and civilian deaths for the Allied and the Axis Powers.

The countries with the largest number of casualties were the Soviet Union, China, Germany, Poland, and Indonesia. As a percentage of the population, the nations with the  largest number of casualties were Lithuania, Poland, Latvia, Germany, and the Soviet Union.

For the Allied forces, the heaviest casualties were inflicted on the civilian population, whereas the largest number of casualties for the Axis forces were inflicted on the military.