Category Archives: Charts

Migrant Remittances Continue to Rise

click to enlarge

click to enlarge

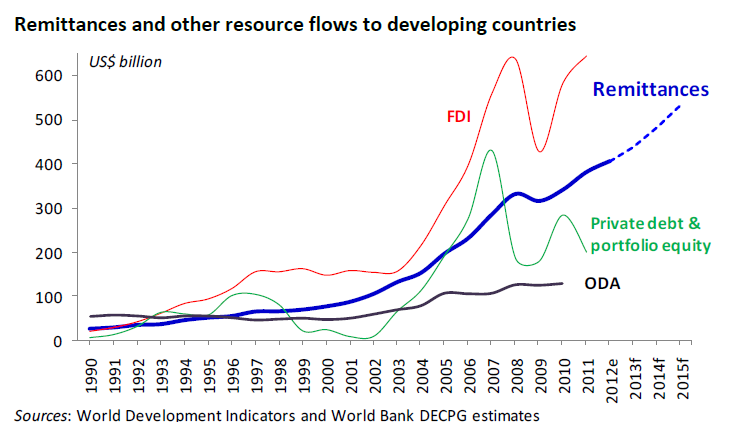
Migrant remittances to developing countries are expected to reach $406 billion in 2012, a 6.5 percent increase over the previous year, and $534 billion in 2015. These officially recorded remittances have kept increasing despite high remittance costs and the financial crisis. This source of income for developing economies constitutes more than three times the size of Official Development Assistance (ODA).

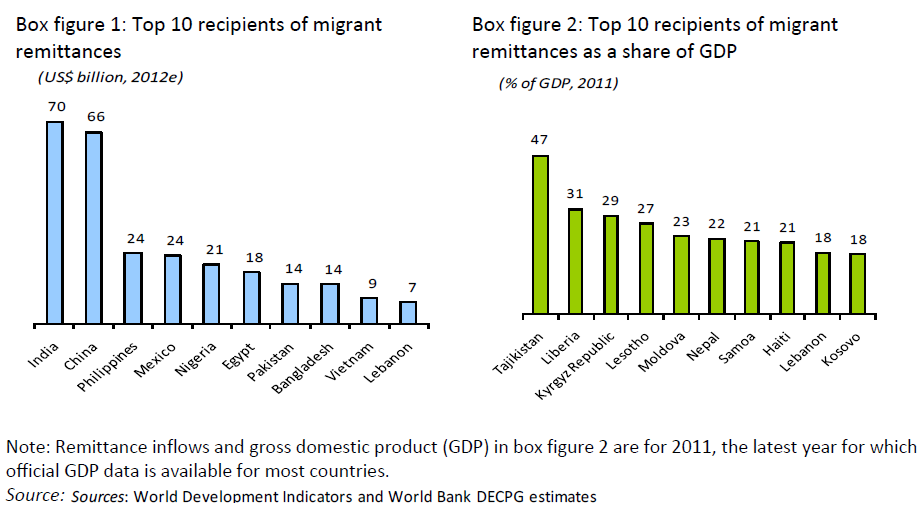
The highest recipients of migrant remittances among developing economies for 2012 are India, China, the Philippines and Mexico. As a percentage of GDP, the highest recipients in 2011 were Tajikistan, Liberia, the Kyrgyz Republic and Lesotho.

Resources:


The Wild Wild Weather

click to enlarge

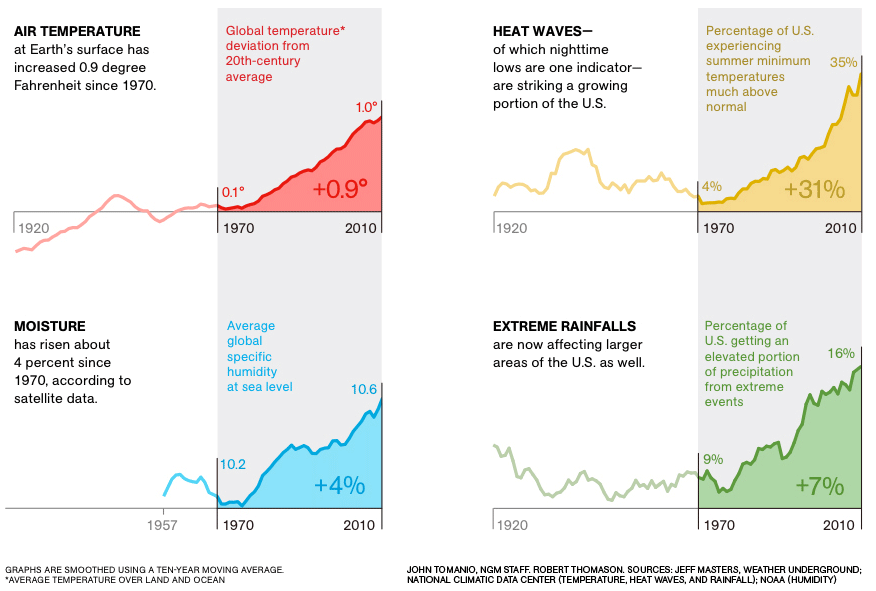
Temperatures on the Earth’s surface and moisture levels in the atmosphere have been on the rise. These two factors might be at the root of the drastic change in weather patterns causing severe droughts, heat waves, heavy rains and other extreme weather phenomena.

In its September 2012 edition, the National Geographic magazine featured an extensive article on extreme weather affecting the U.S.


Income Distribution by Religious Belief Groups

Click to enlarge

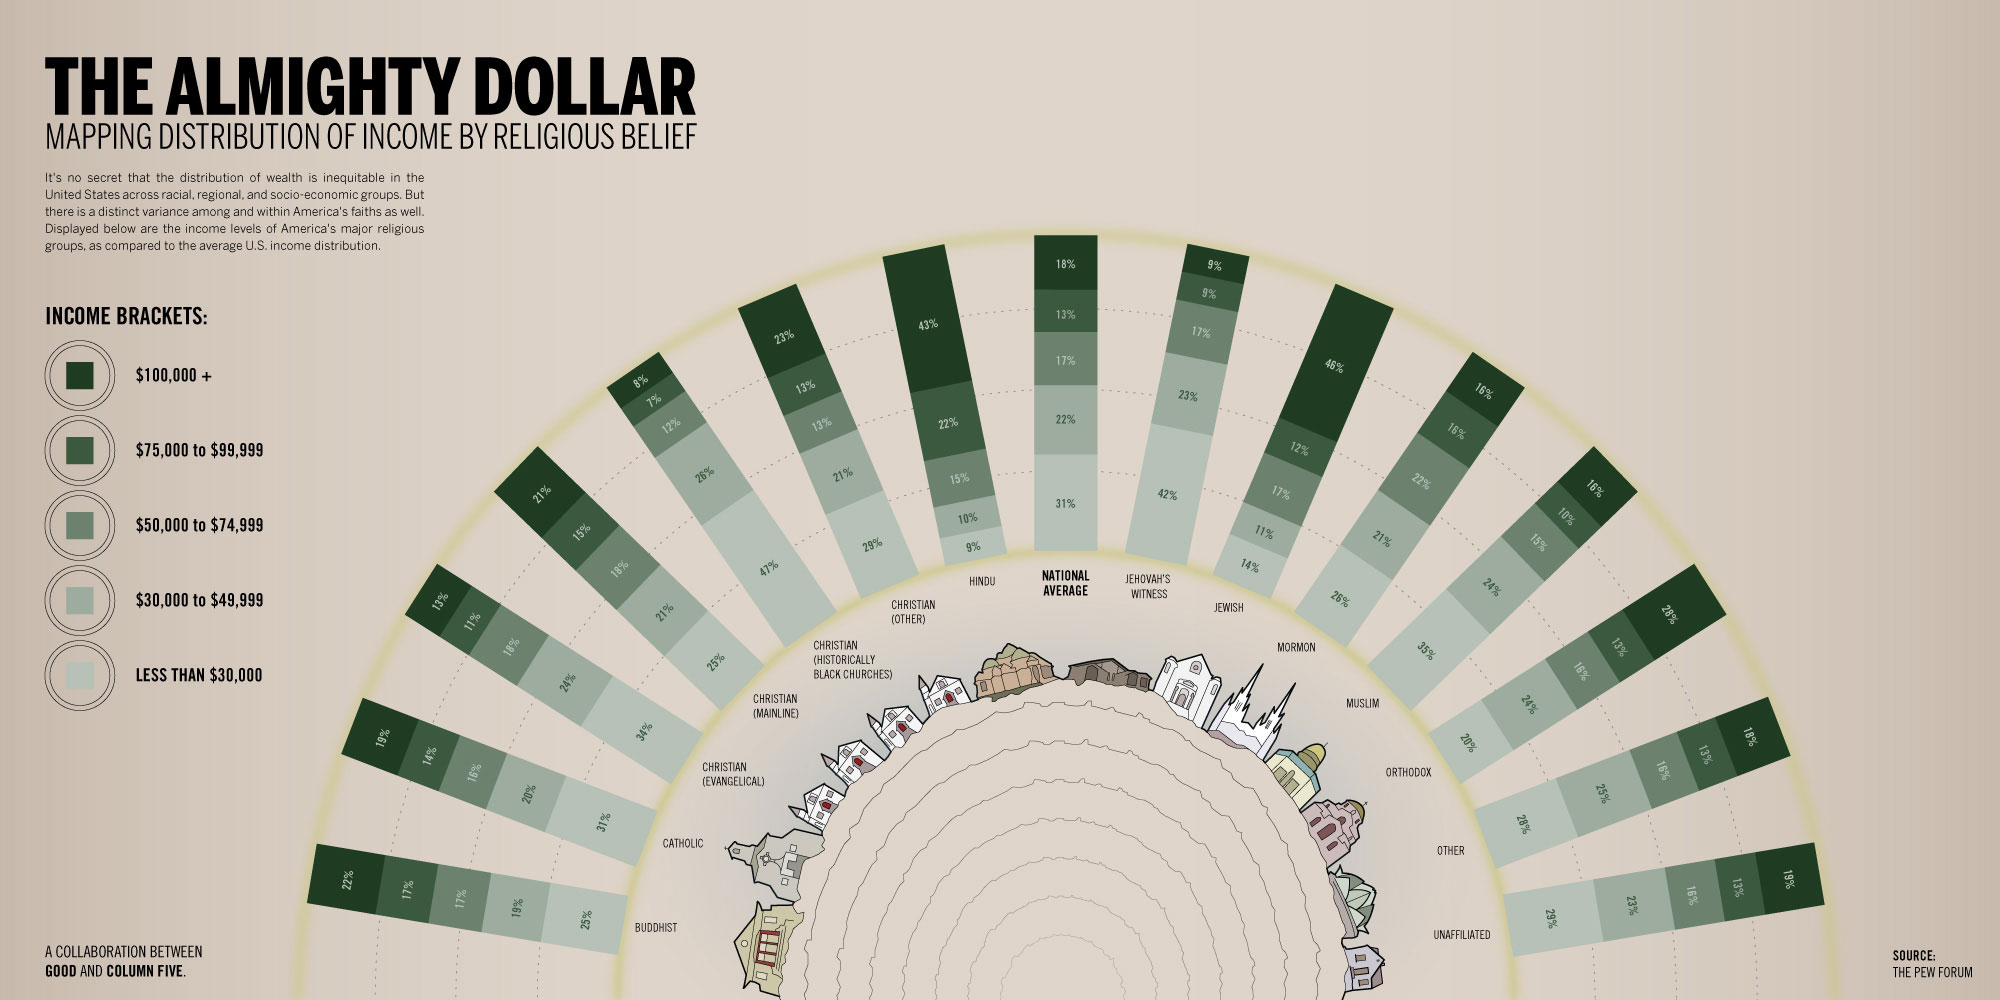
This infographic by GOOD shows the income distribution according to different religious belief groups. It is interesting to notice that 43% of people with Hindu beliefs earn an average income of 100K or more. For people with Jewish beliefs the percentage is 46%, compared to 21% for people with Christian beliefs (mainline), and 8% for people with Christian beliefs (Black churches). Click on the image for more detail.


Of Beer and Politics

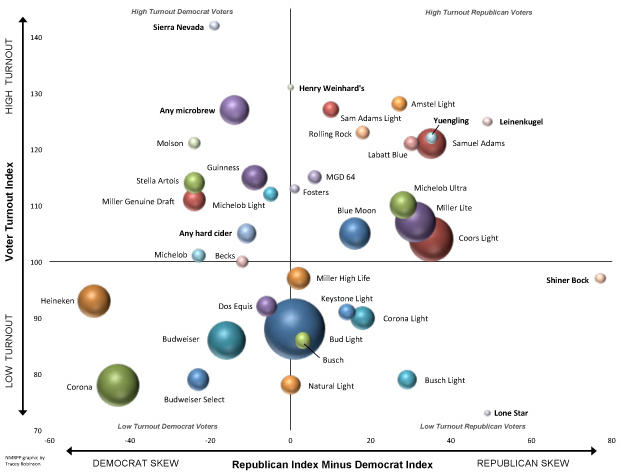
According to an article published by the National Journal, the brand of beer you drink is related to how you will vote in the upcoming elections. If you like Coors Light or Samuel Adams, you are likely to vote Republican. On the other hand, if you like Heineken or Guinness, you are likely to vote Democrat. Dos Equis and Bud Light are beer brands liked on both sides of the aisle.

Related links:


Bleak Estimates for Corn Yields and Grain Stocks for 2012

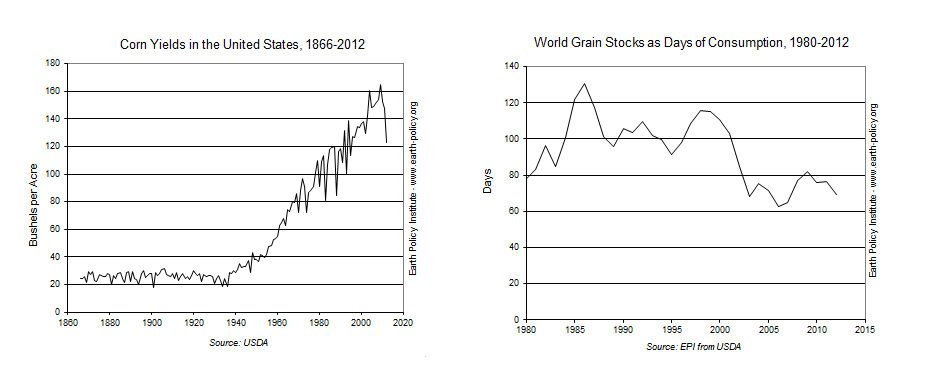
According to the Earth Policy Institute, drought conditions have generated bleak corn yield estimates for the remainder of 2012. Corn yields for September 2012 are estimated at 123 bushels per acre, which would make it the lowest yield since 1995. Compare this yield to the highest ever value of 165 bushels per acre, which was last reached in 2009.

As a consequence, the price of corn has increased significantly. It reached a record high of $8 per bushel in the corn futures market back in July, and has fluctuated around that price since then. Another consequence is the expected fall in global grain supplies. Supplies are expected to fall to 432 million tons, or 69 days of global consumption.

The Relationship Between Riots and High Food Prices

The relationship between riots and high food prices

According to a new study released by researchers at the New England Complex Systems Institute in Cambridge, high food prices play a direct role in the rise of political instability in North Africa and the Middle East. As shown in the graph above, when the UN food price index rises above a certain level, the number of riots increases around the world. The study mentions two factors that are leading to higher food prices: investor speculation in the commodities market, and the use of corn for the production of ethanol in the US.

Poverty in the U.S.

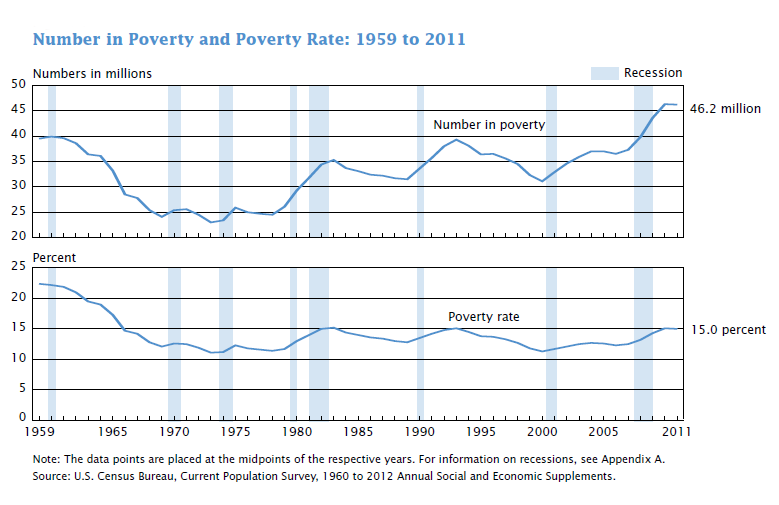
According to data just released by the U.S. Census Bureau, 15% of the population lives in poverty, that is 46.2 million of people. Those numbers are not statistically different from the 2010 estimates. In 2011 the poverty threshold for a family of four was $23,021.

The poverty rate for males decreased between 2010 and 2011 to 13.6%, and remained the same for females at 16.3%. The poverty rate for Hispanics declined between 2010 and 2011. By age, the group with the highest poverty rate was that of children under 18 at a rate of 21.9%. By region, the only region to show a significant change was the South with a decline in the poverty rate from 16.8% to 16.0%. Read more…


The Role of Social Media in Politics

The role of social media in the political arena has increased considerably as of lately. During the Democratic National Convention, last week, it was clear that social media was an important channel for disseminating information as events were taking place. According to the online site TechCrunch, first lady Michelle Obama’s speech had generated 28 thousand tweets per minute.

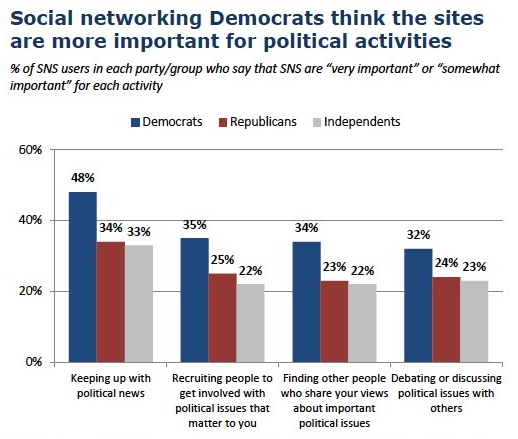
A report published by the Pew Research Center, based on a survey on social network site users, states that Democrats are more likely to consider the use of social media important or very important in keeping up with political news, recruiting people for their cause, discussing political issues with other people and finding other people who share their political views, compared to their Republican or Independent counterparts.

Sugar Prices in Europe

The absurdities of the European system of sugar subsidies are highlighted today in a New York Times article. Rampant fraud and corruption plague a byzantine system of rules and regulations created to support a program that primarily benefits large multinational corporations. Because of the subsidies, consumers in the European Union pay an average retail price of $0.63 per pound, while the global average is only about $0.36 per pound.

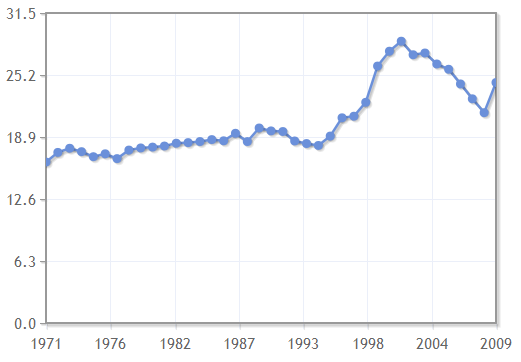
The historical trend of the European wholesale import price can be studied in further detail in our commodities section. Click on the graph below to manipulate and download the data.

Sugar, European import price - Monthly Price - Commodity Prices