Category Archives: Charts

Brazilian Real US Dollar Exchange Rate

The following graph shows the exchange rate of the Brazilian Real with respect to the US Dollar. The Real appreciated continuously since March 2003, depreciating temporarily between September 2008 and February 2009.

Brazilian Real US Dollar Exchange Rate

Source: Banco Central do Brasil – Time Series Management System

See also: Historical exchange rates for multiple currencies

Tipo de Cambio Nuevo Sol Peruano Dólar

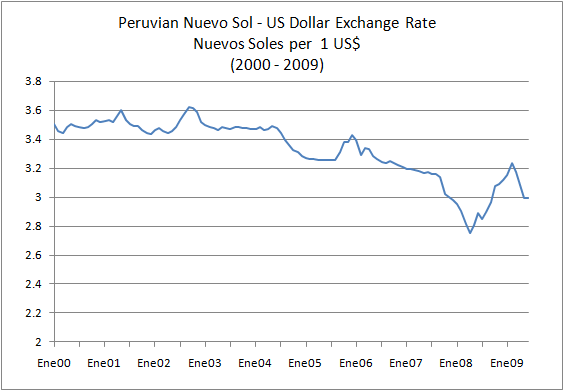
El tipo de cambio del nuevo sol peruano con respecto al dólar americano se mantuvo relativamente constante, con un valor entre 3.6 y 3.0 para el periodo 2000-2007.

Entre diciembre 2007 y septiembre 2008 el tipo de cambio cayó por debajo de 3.0 nuevos soles por 1 USD. A partir de octubre 2008 el tipo de cambio empezó a depreciarse nuevamente pasando por encima de los 3.0 nuevos soles por dólar. Desde mayo del 2009 el nuevo sol empezó a apreciarse otra vez.

Tipo de Cambio Nuevo Sol Peruano Dolar

Fuente: Banco Central de Reserva del Perú

Ver también: Series históricas para otras monedas

Peruvian Nuevo Sol US Dollar Exchange Rate

The Peruvian nuevo sol has maintained a relatively stable exchange rate between 3.6 and 3.0 with respect to the US dollar for the period 2000-2007.

Between December 2007 and September 2008 the exchange rate fell below 3.0 nuevos soles per 1 USD, a rate not seen since 1997. As of October 2008 the nuevo sol started to depreciate again, passing the 3.0 mark. Since May 2009 the nuevo sol has been falling again.

Peruvian Nuevo Sol US Dollar Exchange Rate

Source: Banco Central de Reserva del Perú

See also: Historical exchange rates for multiple currencies

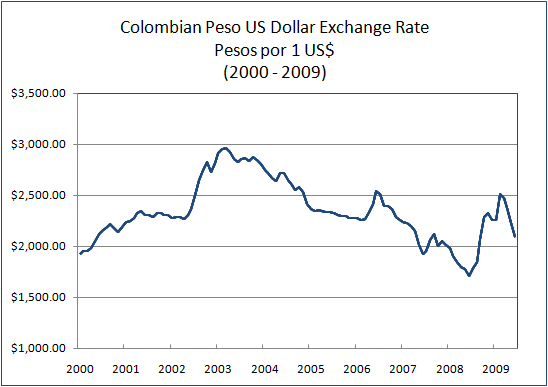
Colombian Peso US Dollar Exchange Rate

The following graph shows the monthly average exchange rate of the Colombian peso with respect to the US Dollar for the period 2000-2009. The Colombian peso depreciated between July 2008 and February 2009 after a long period in which it showed an appreciation trend. It started to appreciate again on March 2009.

Colombian Peso US Dollar Exchange Rate

Source: Banco de la Republica de Colombia – Exchange Rates

See also: Historical exchange rate for the Colombian peso

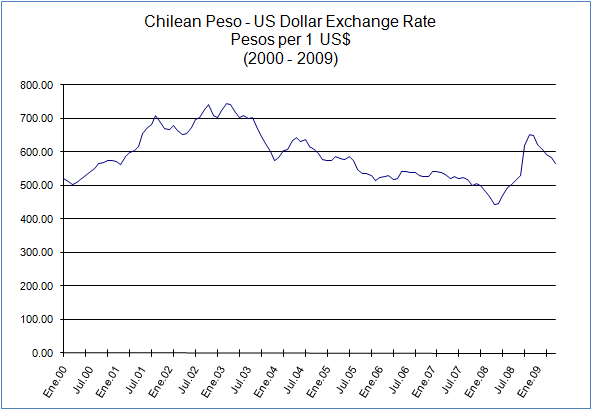
Chilean Peso US Dollar Exchange Rate

The chart below shows the exchange rate of the Chilean peso with respect to the US dollar since January of 2000. Between February 2003 and February 2008, the value of the Chilean peso appreciated with respect to the US dollar. That trend reversed into depreciation starting March 2008. Since November 2008, the Chilean peso started to appreciate again against the US dollar.

Chilean Peso US Dollar Exchange Rate

Source: Banco Central de Chile

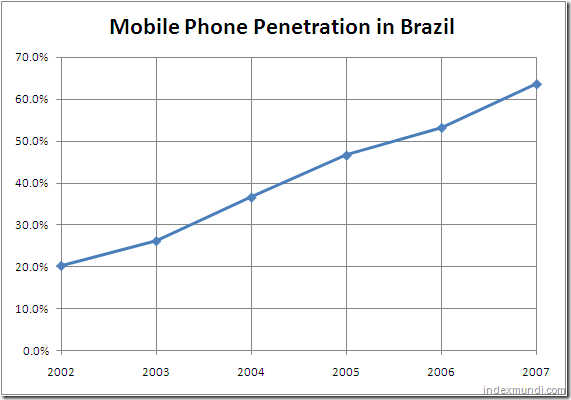
Mobile Phone Penetration in Brazil

The cell phone penetration rate in Brazil as of 2007 was 63.6%, according to the Brazilian National Telecommunications Agency. With a population of almost 200 million people, Brazil is one of the World’s largest markets for mobile phone manufacturers. The chart below shows mobile phone penetration in Brazil from 2002 thru 2007.

Mobile phone penetration in Brazil 2002-2007

Source: National Telecommunications Agency of Brazil

See also: Mobile phone penetration in China and in India

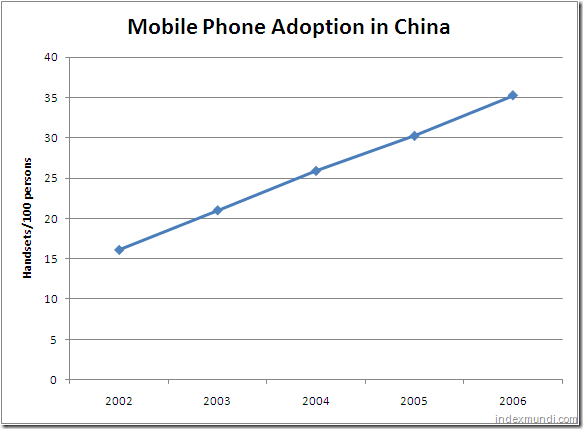
Mobile Phone Adoption in China

Cell phone penetration in China as of 2006 was only 35.3 handsets per 100 people. Considering that the population of China is over 1.3 billion, we can estimate that there are at least 463 million mobile handsets in operation. More interestingly, given that mobile phone penetration rates in more advanced countries are over 75%, as China continues to develop the market for cell phones will more than double in size.

The chart below shows mobile phone adoption in China from 2002-2006.

Mobile phone adoption in China 2002-2006

Source: National Bureau of Statistics of China