Category Archives: Commodities

California’s Skyrocketing Gas Prices

click to enlarge

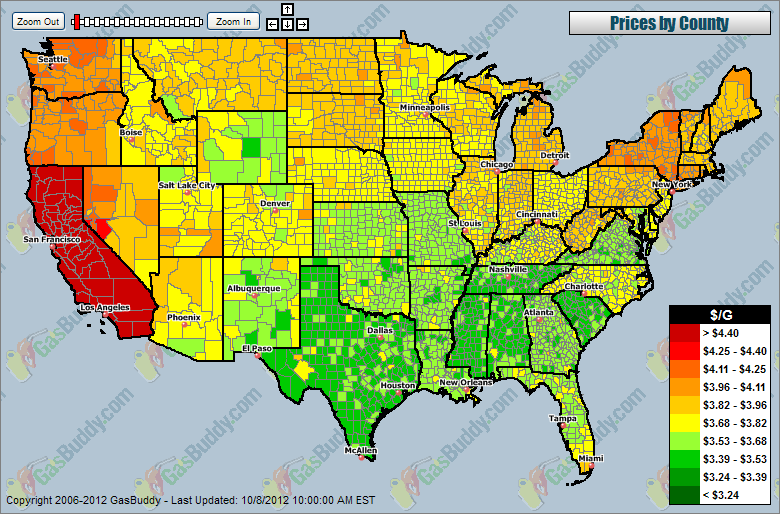
Gasoline prices in the U.S. have been rising lately, but for California the increase has been steeper. According to data of gas prices per county compiled by GasBuddy.com, prices in California are the highest in the U.S. California’s gas prices skyrocketed over the weekend due to supply disruption caused by a power outage to an Exxon Mobil plant in that state. As a result, regular gasoline reached an average record price of $4.614 per gallon.
 

How Many of Gallons of Gas Can You Purchase With Your Weekly Income?

Click to enlarge

The average weekly income in the US has been going up in the last fifty years, at least in nominal terms, as seen in the first graph. The price of a gallon of gas has been trending up as well, with spikes beginning in 2002 up to 2008, when gas prices decreased dramatically as a consequence of the economic recession. In 2010 gas prices increased again and continue rising to this day, as seen in the second graph. It is worth noting that the number of gallons of gas that can be purchased by a person earning an average income has been decreasing steadily since 1998.


Bleak Estimates for Corn Yields and Grain Stocks for 2012

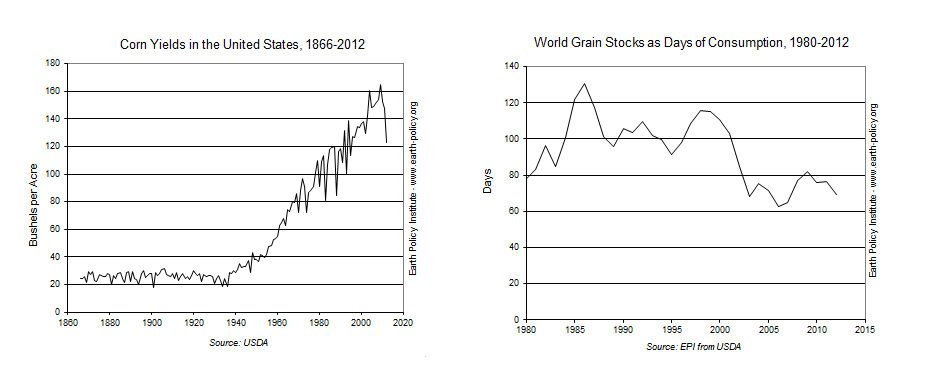
According to the Earth Policy Institute, drought conditions have generated bleak corn yield estimates for the remainder of 2012. Corn yields for September 2012 are estimated at 123 bushels per acre, which would make it the lowest yield since 1995. Compare this yield to the highest ever value of 165 bushels per acre, which was last reached in 2009.

As a consequence, the price of corn has increased significantly. It reached a record high of $8 per bushel in the corn futures market back in July, and has fluctuated around that price since then. Another consequence is the expected fall in global grain supplies. Supplies are expected to fall to 432 million tons, or 69 days of global consumption.

The Relationship Between Riots and High Food Prices

The relationship between riots and high food prices

According to a new study released by researchers at the New England Complex Systems Institute in Cambridge, high food prices play a direct role in the rise of political instability in North Africa and the Middle East. As shown in the graph above, when the UN food price index rises above a certain level, the number of riots increases around the world. The study mentions two factors that are leading to higher food prices: investor speculation in the commodities market, and the use of corn for the production of ethanol in the US.

World Supply of Biggest Crops Decline and Food Prices Rise

The worst drought in fifty years has caused a decline in the stockpiles of crops such as corn, soybeans, rice and wheat, with the subsequent all-time increase in the prices of corn and soybeans. Good news for commodities investors.

The drought has also affected fuel and power production which, in turn, have a negative effect on food prices. Read more…

  1. Unfavourable weather behind the July rebound of the FAO Food Price Index – FAO Food Price Index [Food and Agricultural Organization of the United Nations]
  2. America’s disastrous corn harvest will hit world’s poor hardest [The Guardian]
  3. World food prices rising in response to drought damage in the US – Ole Hansen [TradingFloor.com]
  4. Global food reserves falling as drought wilts crops – Tony C. Dreibus and Elizabeth Campbell, Bloomberg [Futures Magazine]
  5. USDA slashes corn yield, production forecast – Bill Tomson [Market Watch]


Rare Earth Metals and Their Importance in Today’s Economy

  1. Rare-earth mining in China comes at a heavy cost for local villages [The Guardian]
  2. Rare earth metals: North Korea’s new trump card [The Korea Herald]
  3. EU Fights to Catch Chinese in Greenland Rare-earths Gold Rush – Agence France-Presse [Industry Weekly]
  4. World Trade Organization to Investigate China’s Limits on Rare-Earth Exports – Marketwire [SYS-CON Media]
  5. Rare Earth Elements – Dr. Ileana Johnson Paugh [Canada Free Press]

Visualizing Commodity Trading

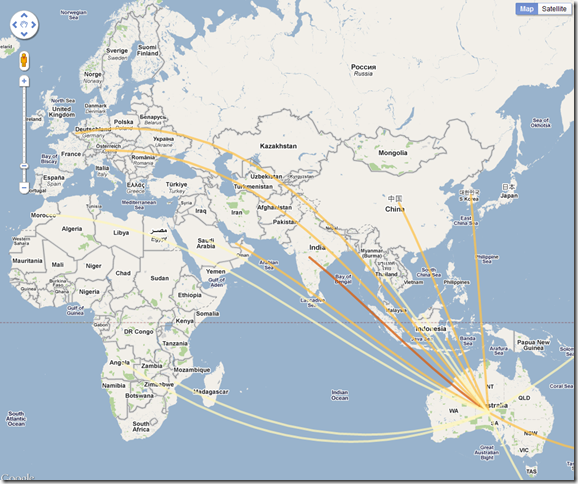
We are currently processing the results of our commodities trade survey. We figured that a good way to display the results would be through a map visualization showing trade flows to and from each country represented in the survey. The image below shows one of the visualizations (click on it for a larger version).

commodities trade flows from Australia

The map shows trade flows from Australia. Lighter lines represent trade flows with a small number of deals. Darker lines are used for trade flows with larger number of deals. Stay tuned for more results.

Update (August 15th, 2011): You can now play with our trade flow visualizations.