Category Archives: Prices

Key Commodities and Emerging Markets

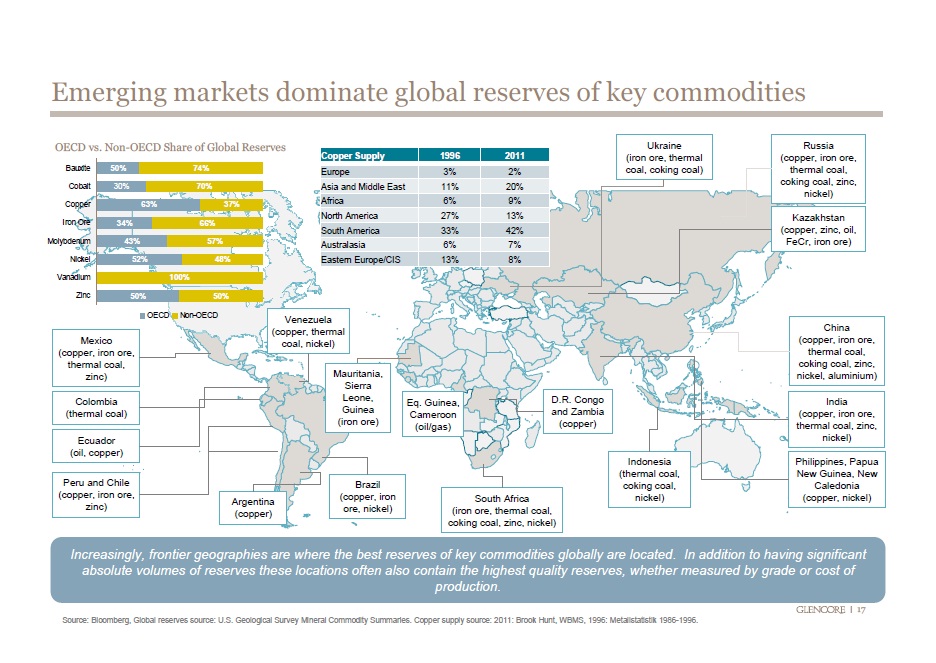
emerging market dominate commoditiesCommodities are raw materials essential for the production of more complex products. Commodities fall into three large categories: agricultural, energy, and metals.

According to this visualization, emerging economies (Brazil, Russia, India Indonesia, China, South Africa, etc.) have the largest reserves of certain key energy and metal commodities such as oil, coal, copper, cobalt, iron ore, molybdenum, nickel, zinc, and aluminum.

Source: Business Insider: 36 Maps That Explain The Entire World


The World’s Largest Oil Reserves by Country

strategic oil reserves worldOil reserves are the amount of oil that can be technically and economically recovered from the ground.

Nations with the world’s largest oil reserves include Saudi Arabia, Venezuela, Iran, Iraq, Kuwait, United Arab Emirates, Russia, and Libya. Saudi Arabia, holds an approximate 234.5 billion barrels of oil reserves, and it has the largest market share for oil production after Russia. Saudi Arabia is followed by Venezuela, with an estimated 211.0 billion barrels of oil reserves, although its current oil production market share is only 3.2%.

By comparison, the United States has an estimated 30.9 billion barrels in oil reserves, and  8.7% market share in oil production.

Source: Spiegel Online: A World without Oil: Companies Prepare for a Fossil-Free Future


The Cheapest and Most Expensive Places to Fill Your Gas Tank

click to enlarge

Gas prices go up or down according to supply-demand forces and to movements in the commodities market. According to this map, published by the Car and Driver blog, prices in the United States ($3.85 per gallon) are not that bad compared to gas prices in other countries.

European nations have the highest gas prices, above $7 per gallon. If you were in Turkey you will have to pay the highest price, a steep $9.39 per gallon. Turkey’s gas prices are followed by Norway ($9.38), Italy ( $9.00), Sweden ($8.75), the United Kingdom ($8.46), Germany ($8.29), and Iceland ($8.01).

In the Americas, the highest gas prices can be found in Belize ($7.59), followed by Uruguay ($6.99), Chile($6.60), Peru ($5.95), Argentina ($5.52) and Canada ($5.14). Gas prices are significantly low in Venezuela ($0.06) and Bolivia ($2.05) due to government subsidies.

Africa enjoys low gas prices, except for Djibouti ($6.48), Madagascar ($5.74), Zimbabwe ($5.38), and South Africa ($5.15).

In Asia, Japan pays the highest gas prices, $6.87 per gallon, followed by the Philippines ($5.43), and India ($5.42).

In Australia, New Zealand and Australia’s gas prices per gallon are $6.75 and $5.64, respectively.
 

Colombian Coal

We recently added Colombian coal to the list of commodities that we track in our commodities section. You can now analyze the average monthly price of Colombian coal for the past 30 years, as seen in the graph below.

Coal, Colombia - Monthly Price - Commodity Prices - Price Charts, Data, and News - IndexMundi

In addition to monthly price data, we also have production, consumption, exports, and imports of Colombian coal in terms of quantity, and value in dollars of Colombian coal exports and imports.

California’s Skyrocketing Gas Prices

click to enlarge

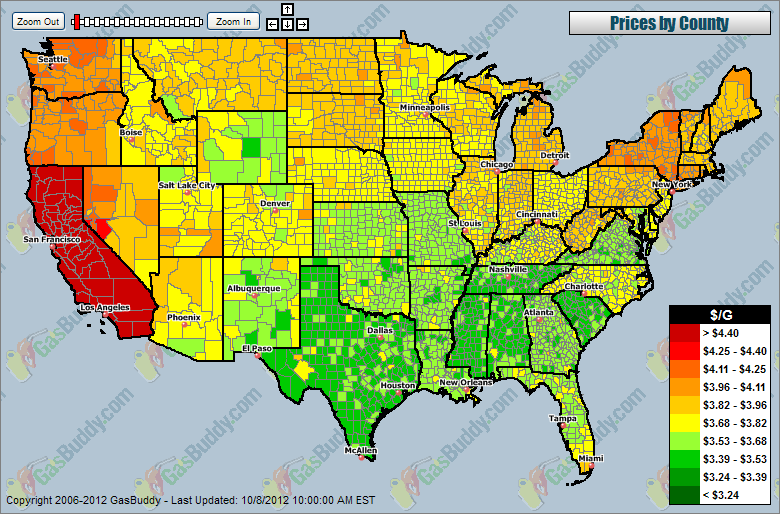
Gasoline prices in the U.S. have been rising lately, but for California the increase has been steeper. According to data of gas prices per county compiled by GasBuddy.com, prices in California are the highest in the U.S. California’s gas prices skyrocketed over the weekend due to supply disruption caused by a power outage to an Exxon Mobil plant in that state. As a result, regular gasoline reached an average record price of $4.614 per gallon.


How Many of Gallons of Gas Can You Purchase With Your Weekly Income?

Click to enlarge

The average weekly income in the US has been going up in the last fifty years, at least in nominal terms, as seen in the first graph. The price of a gallon of gas has been trending up as well, with spikes beginning in 2002 up to 2008, when gas prices decreased dramatically as a consequence of the economic recession. In 2010 gas prices increased again and continue rising to this day, as seen in the second graph. It is worth noting that the number of gallons of gas that can be purchased by a person earning an average income has been decreasing steadily since 1998.


The Relationship Between Riots and High Food Prices

The relationship between riots and high food prices

According to a new study released by researchers at the New England Complex Systems Institute in Cambridge, high food prices play a direct role in the rise of political instability in North Africa and the Middle East. As shown in the graph above, when the UN food price index rises above a certain level, the number of riots increases around the world. The study mentions two factors that are leading to higher food prices: investor speculation in the commodities market, and the use of corn for the production of ethanol in the US.

Sugar Prices in Europe

The absurdities of the European system of sugar subsidies are highlighted today in a New York Times article. Rampant fraud and corruption plague a byzantine system of rules and regulations created to support a program that primarily benefits large multinational corporations. Because of the subsidies, consumers in the European Union pay an average retail price of $0.63 per pound, while the global average is only about $0.36 per pound.

The historical trend of the European wholesale import price can be studied in further detail in our commodities section. Click on the graph below to manipulate and download the data.

Sugar, European import price - Monthly Price - Commodity Prices

Historical Commodity Prices

I just updated the historical commodity prices section with the latest IMF data. Historical data for 8 price indices and 49 commodities now includes June 2008 numbers. I’m including a chart showing that the aggregate commodity price index, i.e. the index that tracks energy, metals, food, and raw materials, continued its upward march in June. It increased 5.7% with respect to May 2008, 32.6% with respect to January 2008, and 62% with respect to June 2007. Inflation has clearly become a serious problem around the World.

Commodity Price Index - Monthly Price - Commodity Prices

Click on the image above to play with the data