Category Archives: Brazil

Hunger Map 2012

mdg hunger map 2012One of the targets of the Millennium Development Goals (MDG) is to reduce the number of people with hunger by half by the year 2015. An estimated 870 million people still suffer from hunger around the world.

This map published by the Food and Agriculture Organization of the United Nations (FAO), shows that a good number of developing nations have made progress toward reaching that goal, as can be seen for the countries in green, with East Asia and Latin America as the top performers. On the other hand, many countries in Africa and West Asia have not made any progress, or worse, their situation has even deteriorated as can be seen for the countries in yellow or red.


World Production of Rare Earth Metals

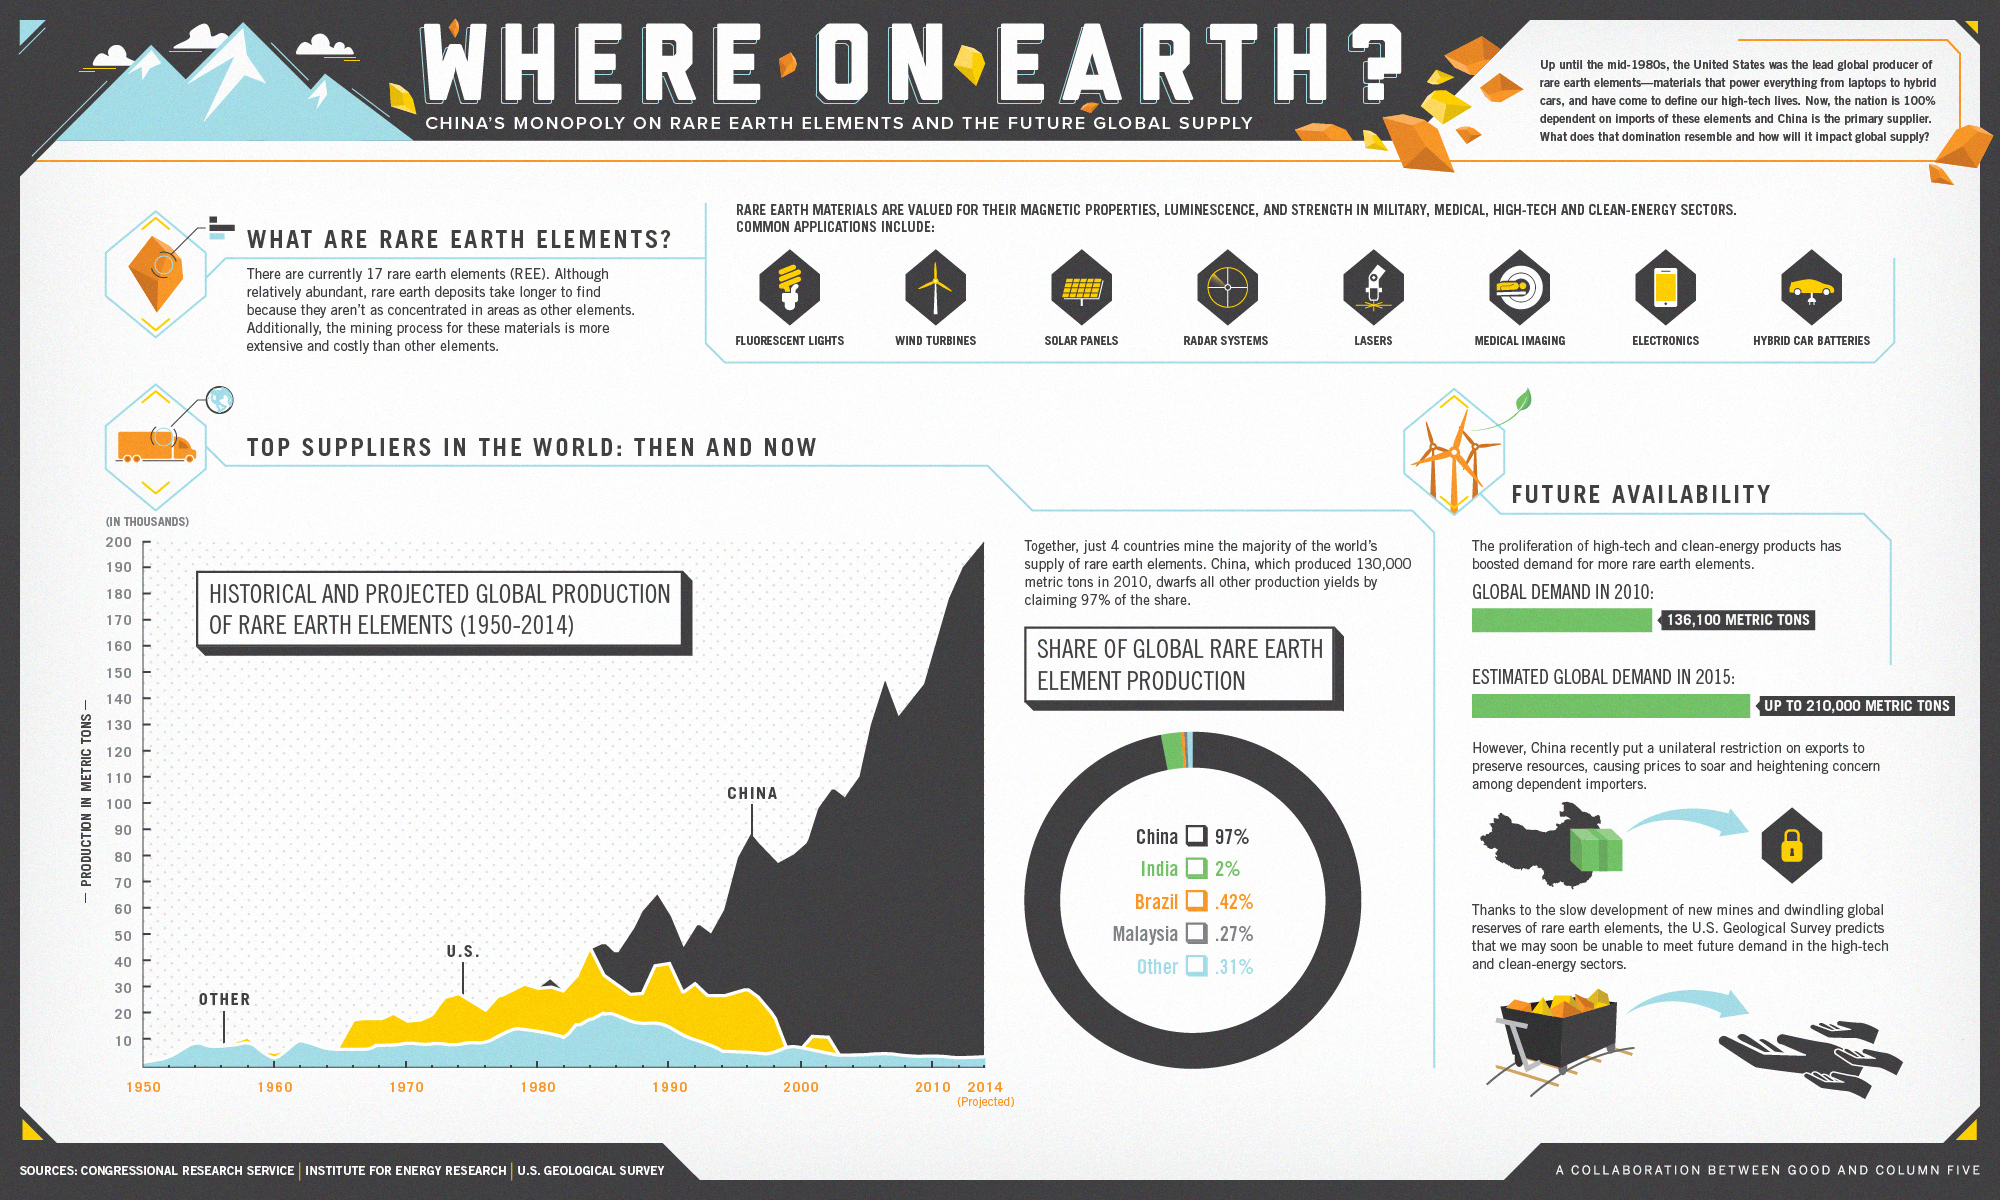
the future global supply of rare earth elementsRare earth metals or rare earth elements are a collection of seventeen chemical elements located at the bottom of the periodic table. They are key elements in the manufacture of high technology components, hybrid cars, solar panels, lasers, electronics, etc.

As of 2010, China produced 97% of the total world production of rare earths, or 130,000 metric tons, followed by India (2%), Brazil (0.42%), and Malaysia (0.27%).

The estimated demand for rare earths for 2015 will increase 54% compared to the demand in 2010.

Source: GOOD: Infographic: The Future Global Supply of Rare Earth Elements

See also: IndexMundi: Commodities Glossary – Rare Earth Metals


Global Attitudes About the Economy

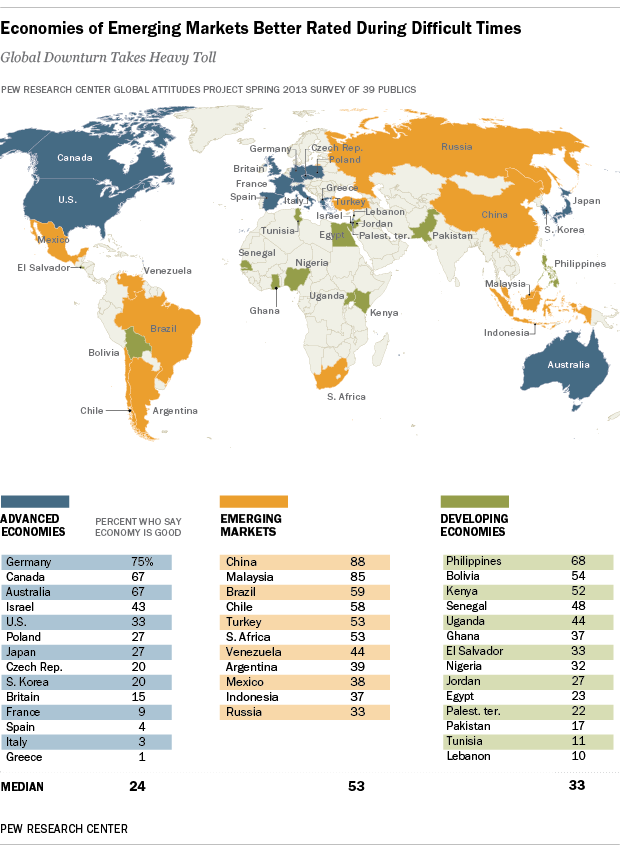
global attitudes about the economyA survey conducted by the Pew Research Center in 39 nations, regarding attitudes about the state of the economy in the respondents’ respective countries, yielded interesting results.

Respondents in emerging economies are the most optimistic. A median of 53% believe their economy is doing well, specially in China and Malaysia. In contrast, respondents in developed economies are the most pessimistic. A median of only 24% say their economy is doing well. European nations such as Greece, Italy, Spain, and France are the most pessimistic of all.

In the case of developing economies, some are somewhat optimistic (Philippines and Bolivia), and other not so much (Tunisia and Lebanon).

Source: Pew Research Global Attitudes Project: Widespread Dissatisfaction with Economy

Read full report: Pew Research Global Attitudes Project: Economies of Emerging Markets Better Rated During Difficult Times


Key Commodities and Emerging Markets

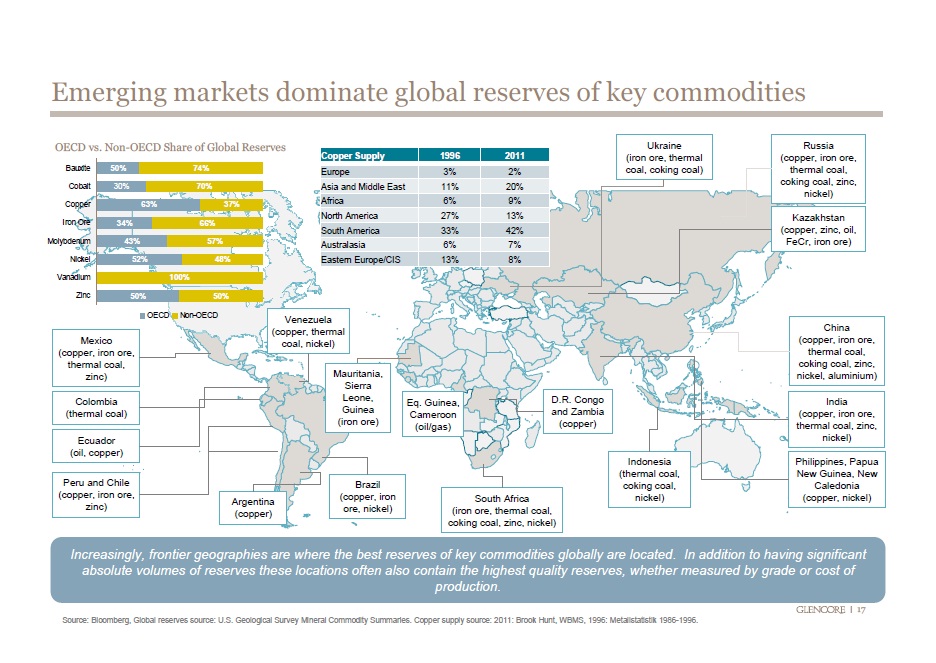
emerging market dominate commoditiesCommodities are raw materials essential for the production of more complex products. Commodities fall into three large categories: agricultural, energy, and metals.

According to this visualization, emerging economies (Brazil, Russia, India Indonesia, China, South Africa, etc.) have the largest reserves of certain key energy and metal commodities such as oil, coal, copper, cobalt, iron ore, molybdenum, nickel, zinc, and aluminum.

Source: Business Insider: 36 Maps That Explain The Entire World


The 50 Largest Ports in the World

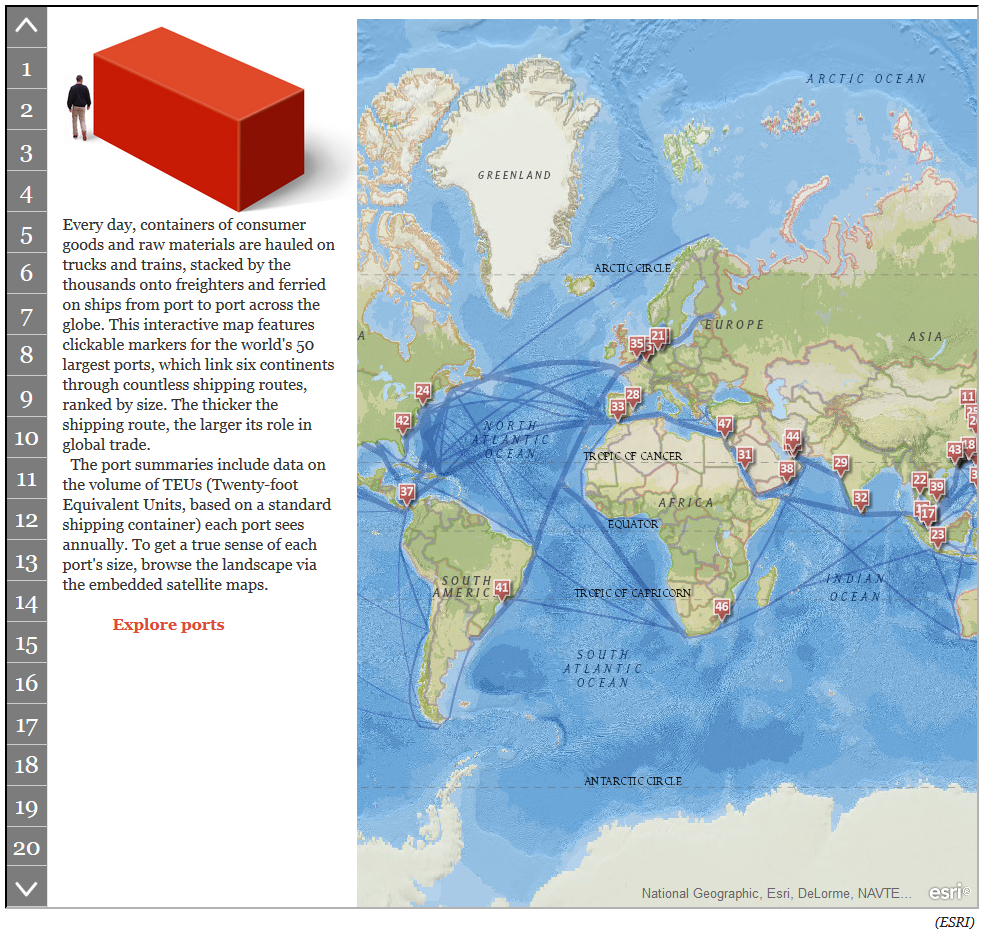
worlds 50 largest portsEvery day finished goods and commodities are transported  by sea in shipping containers from one port to another across the globe. Standard shipping containers measure 20 feet long by eight feet wide, hence they receive the name of “Twenty-foot Equivalent Units” or TEUs.

The largest port in the world is in Shanghai (China) which saw a volume of 31.74 million TEUs of cargo freight passing through its port in 2011. Shanghai is followed by Singapore (Singapore) which saw a volume of 29.94 million TEUs passing through its port for the same year. Singapore is followed by Hong Kong, Shenzhen (China), Busan (South Korea), Ningbo, Guangzhou, and Qingdao (China), Dubai Ports (United Arab Emirates), and Rotterdam (Netherlands), all in the top ten.

For the interactive map, that allows you to explore each one of the largest 50 ports in the world, visit: The Smithsonian: Interactive: The 50 Largest Ports in the World


Body Mass Index (BMI) by Country

A body mass index (BMI) between 18.5 and 24.9 is usually considered a healthy body weight to height relationship. A BMI of 25 or higher indicates body weight not optimal for the height of a particular person.

This visualization published by Visual.ly, shows the different BMI values for adult men and women across the globe.

Countries with a healthy average BMI between 20 and 22.9 include several nations in Africa, Yemen, India, Thailand, Japan, Pakistan, Singapore, among others.

Countries with an average BMI between 23 and 24.9 include several Asian nations, several European nations (including France), some nations in Africa, and Honduras.

Countries with an average BMI between 25 and 26.9 include Canada, Russia, Costa Rica, Colombia, Israel, Austria, Switzerland, Brazil, all Nordic countries, Spain, Portugal, and nations in the Middle East.

Countries with an average BMI of 27 and over  (the highest BMI range) include the United States, Kuwait, Cuba, Argentina, Chile, Bolivia, Peru, Venezuela, Australia, UK, New Zealand, Greece, and Germany to name a few.


Human Development Index 2012

The Human Development Index (HDI) is a composite measure that includes three indicators: life expectancy at birth, level of education attained, and income. The HDI is an alternative to the purely economical GDP, that quantifies economic growth only. Thus, the HDI provide a way to gauge the development of a country. The HDI for 2012 includes 187 countries.

The HDI ranks countries according to their degree of development using a scale from 0 to1, 0 being the least developed and 1 being the most developed country.

In the HDI map above, published by the Brazilian media site Globo.com we find that Norway has a score of 0.955, ranking number one as the most developed country (color green). Norway is followed by Australia, the U.S., the Netherlands, Germany, New Zealand, among others.

At the other end of the spectrum we find the least developed nations (color purple), including the majority of African nations, Pakistan, Afghanistan, Myanmar, Bangladesh, Nepal, and Papua New Guinea.


Paid Maternity Leave Worldwide

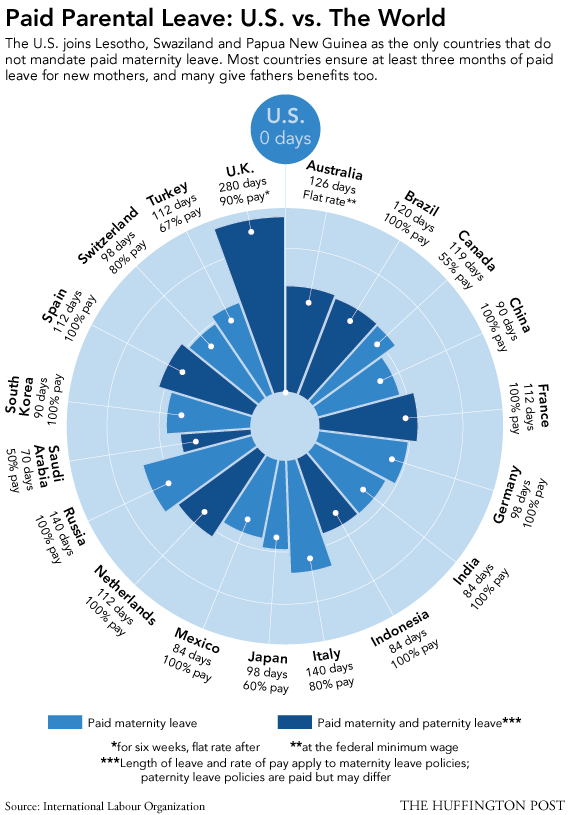
Many developed nations provide paid maternity leave to their female employees. This is not the case for the United States.

According to this visualization by the Huffington Post, the UK provides the highest number of paid maternity leave days, 280 with 90% pay. Brazil, China, France, Germany, India, Indonesia, Mexico, Netherlands, Russia, South Korea, and Spain, offer maternity leave with 100% pay.

In the U.S., parents are guaranteed their jobs for 90 days while on maternity or paternity leave, but without pay. Other countries that do not provide paid maternity leave include Lesotho, Swaziland, and Papua New Guinea, all developing nations.


Food Exports and Imports Worldwide

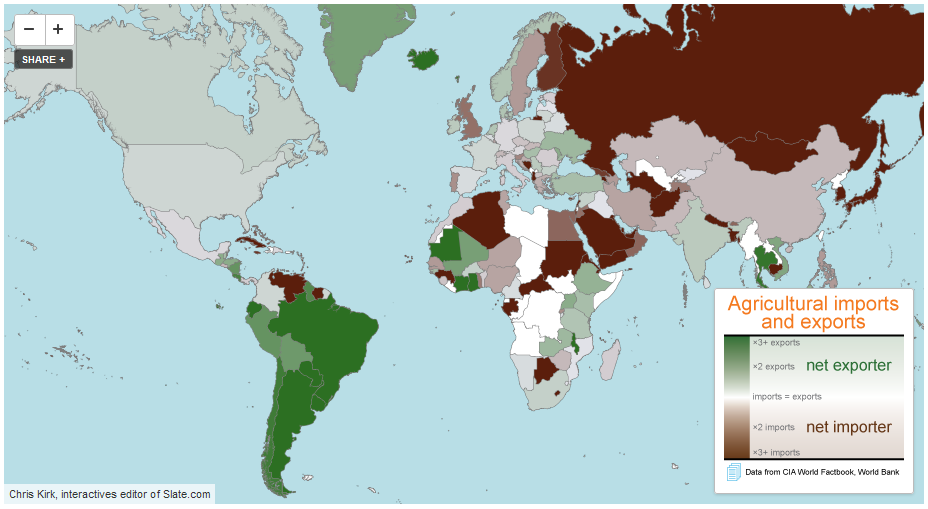
Some countries are net exporters of food (their food exports are larger than their food imports) while others are net importers of food (their food imports are larger than their food exports).

Among the net exporters of food we find the majority of South American countries, with the exception of Venezuela and Suriname, the United States, Canada, Mauritania, Indonesia, Australia, and a few African countries such as Mauritania, Ivory Coast and Ghana. The largest net exporter of food, by far, is Argentina with $23.42 of food exports per every $1.00 of food imports. Argentina is followed by Brazil, New Zealand, Paraguay and Iceland.

Among the net importers of food we find countries such as Russia, Finland, Sweden, the UK, Italy, Germany, Portugal, Sudan, Cuba, Saudi Arabia, Japan, etc. The largest net food importer is Eritrea, with $0.01 of food exports per every $1.00 of food imports. Eritrea is closely followed by Venezuela, Turkmenistan, and Algeria.

Data for for both agricultural exports and imports are for 2010.

Source: Slate.com: Maps: Agriculture in the U.S. and Around the World


Sweet Deal: The Global Trade of Chocolate

click to enlarge

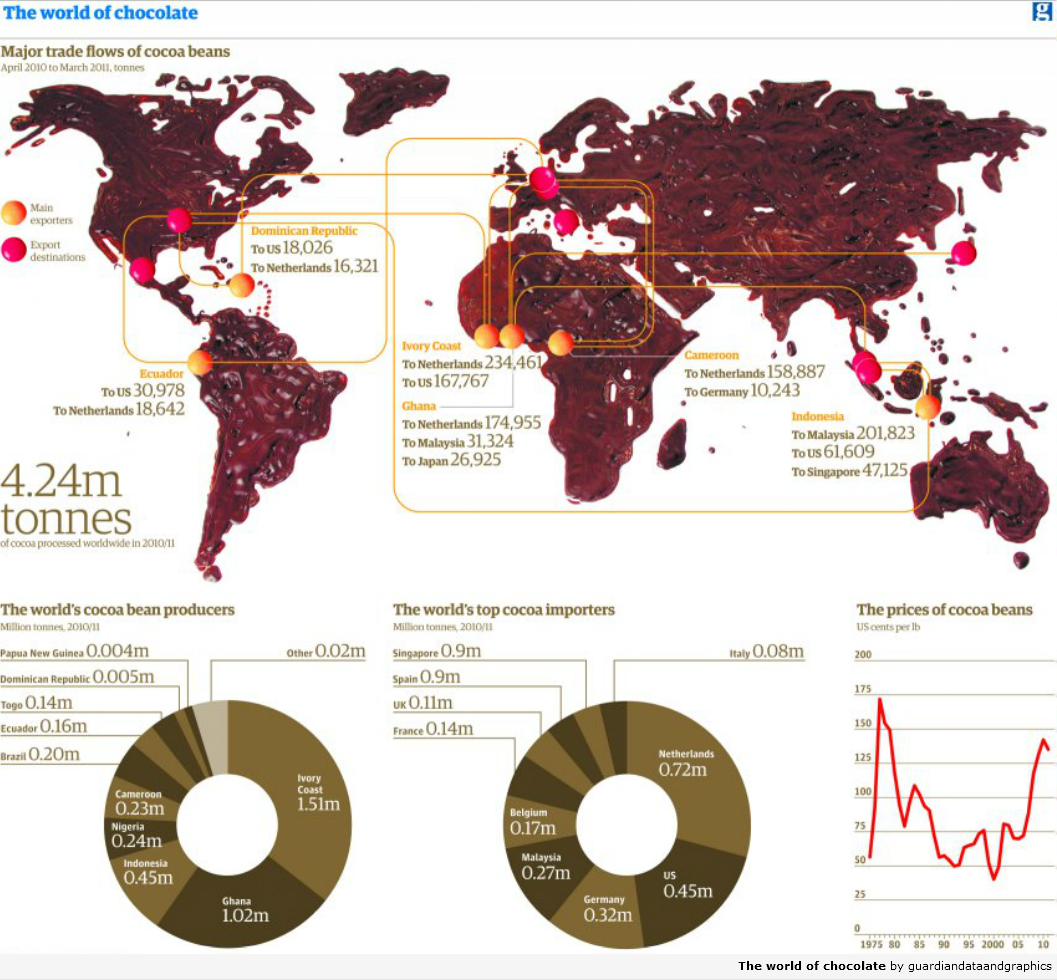
This visualization by The Guardian, actually made out of real chocolate, depicts the world trade (exports and imports) of chocolate. Between 2010 and 2011, 4.24 million tons of cocoa beans were processed worldwide.

The top cocoa bean producers are: Ivory Coast, Ghana, Indonesia, Nigeria, Cameroon, Brazil, and Ecuador, among others. The top importers include: Netherlands, the United States, Germany, Malaysia, Belgium, France, the UK, and Spain.

For a list of the top global confectionery companies, visit: International Cocoa Organization: The Chocolate Industry