Category Archives: China

The Most and Least Ethnically Diverse Countries

diversity map harvardUsing data from the Harvard Institute for Economic Research, The Washington Post created this map that shows how ethnically diverse is a country.

Dark green countries are the more ethnically diverse. Such is the case of Canada, Mexico, several South American countries, including Peru, Bolivia, and Ecuador. The most ethnically diverse countries are located in Africa. In contrast, dark orange countries are more ethnically homogenous. That is the case of most European nations, China, Japan, South and North Korea, and Australia.


China at the Top of Renewable Energy Investment

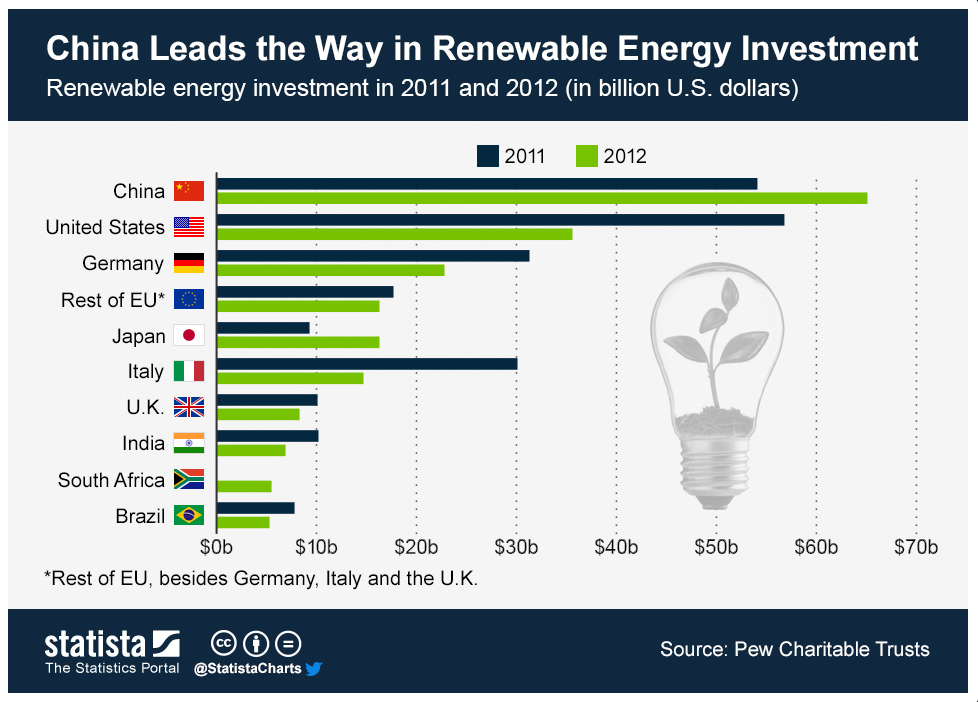
china leads energy investmentIn 2012 China’s investment in renewable energy surpassed the investment by the United States for the previous year and for the same year. In fact, China’s is ahead every other nation including Germany, Japan, and Italy.

China’s investment in renewable energy exceeded $60 billion for 2012, compared to an estimated $36 billion in the United States, and $23 billion in Germany for the same year.

Source: Statista: China Leads the Way in Renewable Energy Investment


Bribes Around the World

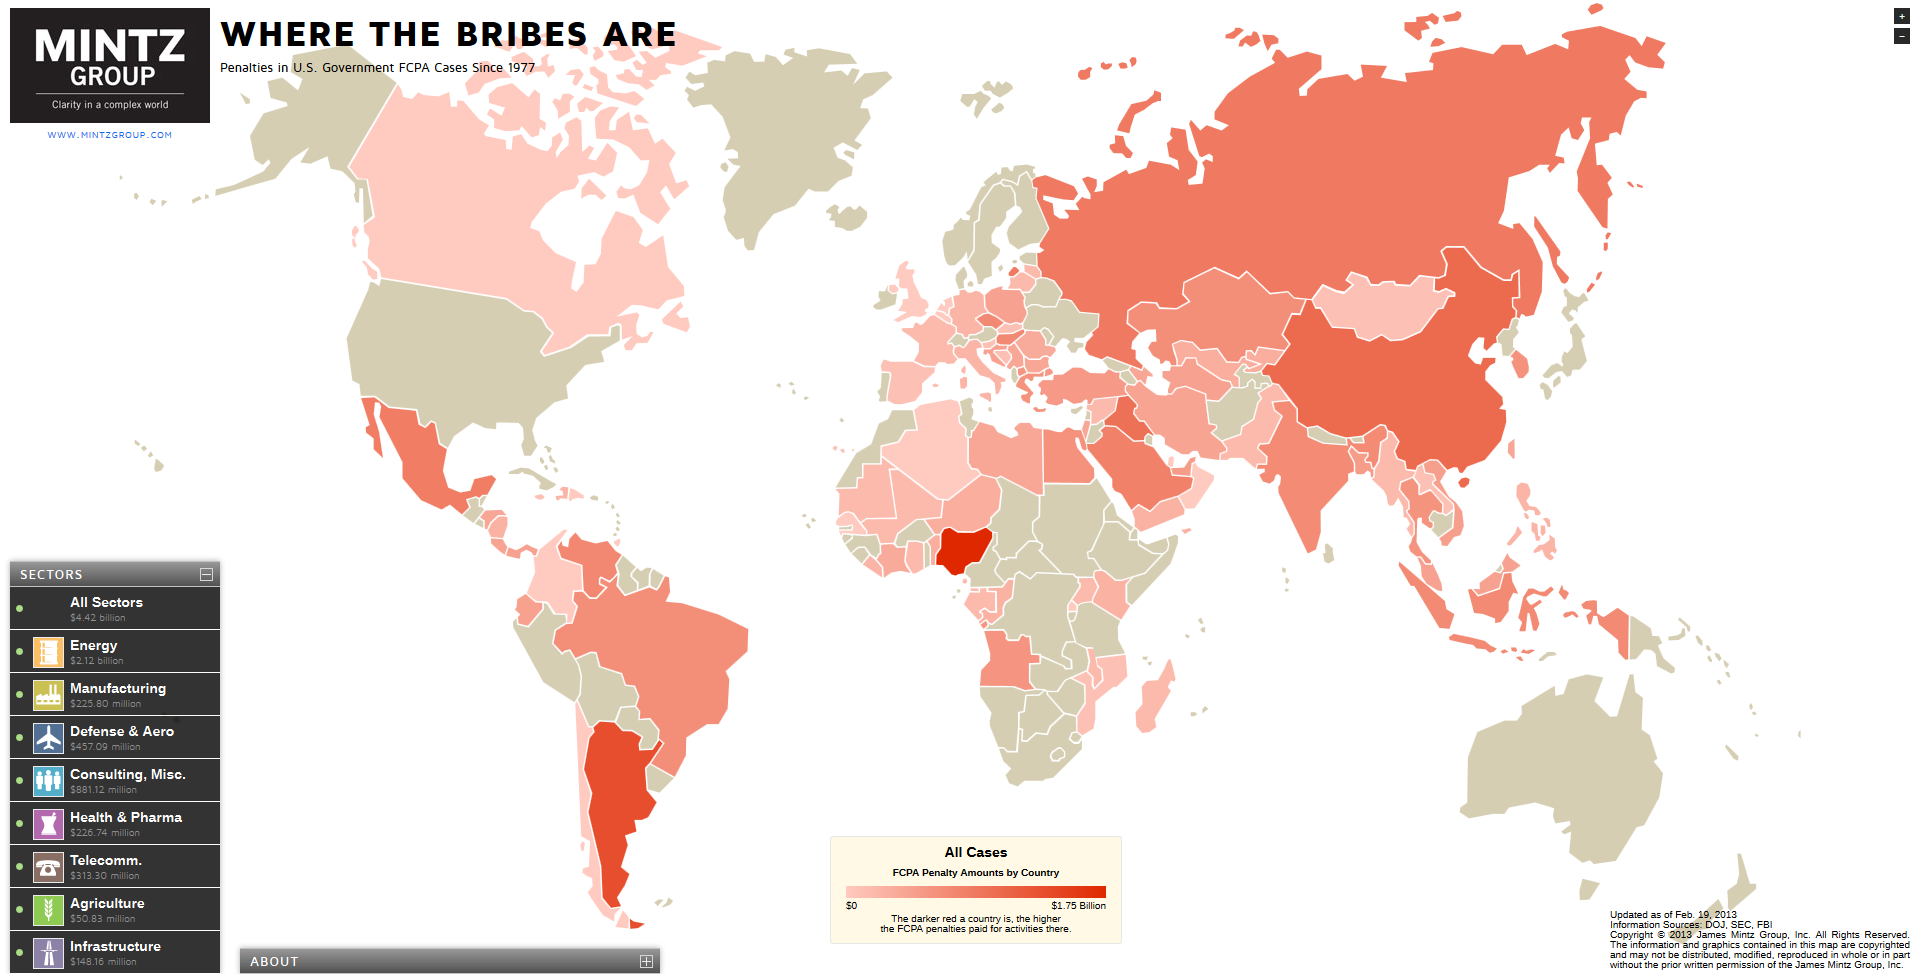
where the bribes areThe Foreign Corrupt Practices Act (FCPA) of 1977 was enacted for the purpose of making it illegal for individuals or entities to make payments to foreign government officials in order to obtain business in a particular country. So far about 200 FCPA violations have been covered in 80 countries.

The darker the color of a country on the map above, the larger the FCPA violations in that country. FCPA violations have been found in different economic sectors: energy, manufacturing, agriculture, consulting, health and pharmaceuticals, telecommunications, defense and aerospace, and infrastructure.

The country with the largest number of FCPA violations is Nigeria, with the majority of bribery cases in the energy sector. Nigeria is followed by Argentina, China, Russia, Iran, and Iraq.

For the interactive map and links to documentation for every FCPA violation, please visit: The Mintz Group: Where the Bribes Are – Penalties in U.S. Government FCPA Cases Since 1977


Oil Production and Consumption by Country

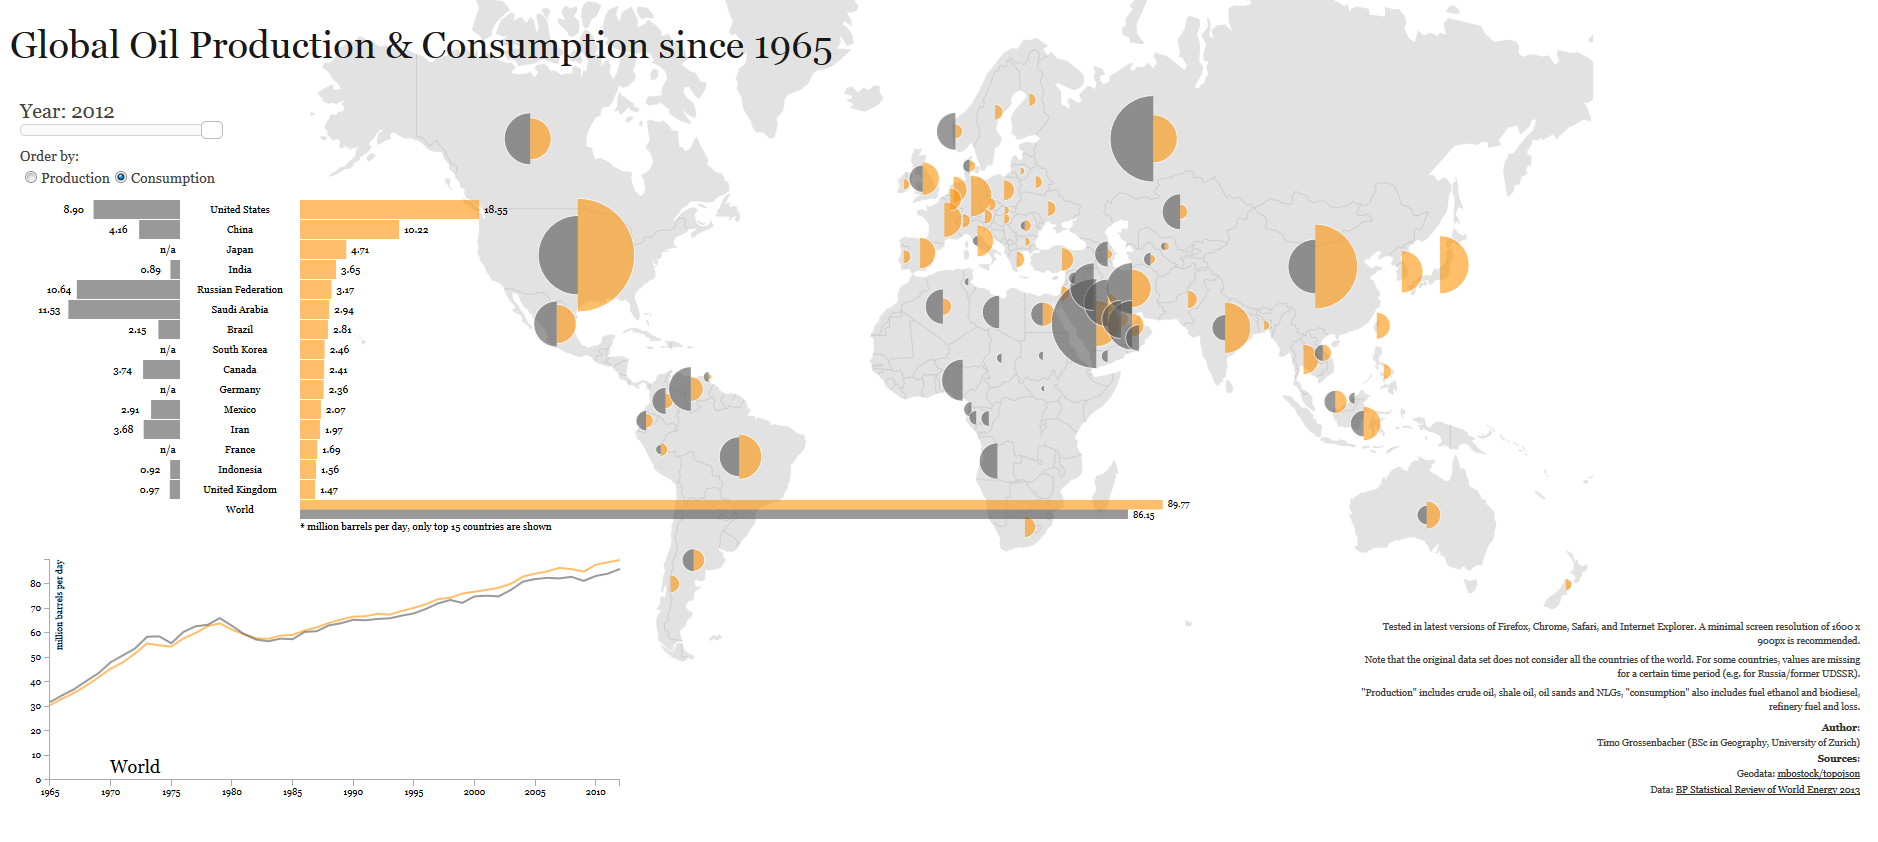
oil production and consumption since 1965When it comes to oil production and consumption, countries have a very close relationship of interdependence with each other. Some countries consume more oil than what they produce relying on imports to satisfy their internal demand. Others, consume less than what they produce, being able to export oil to nations that need it.

Oil consumption (yellow) for the United States, for example, was larger than its production (grey) for 2012, 18.55 mb/d (million barrels per day) compared to 8.9 mb/d, importing more than double its production to satisfy the gap in internal demand. Other nations with oil consumption higher that oil production include China, Brazil, Australia, India, UK, and Indonesia.

In contrast, oil consumption for Saudi Arabia for 2012 is estimated at 2.94 mb/d, while its production reached 11.53 md/d, exporting its oil surplus to the rest of the world. Other nations whose oil production exceeds its oil consumption include Canada, Mexico, Venezuela, Norway, Russia, Kuwait, United Arab Emirates, and Qatar.

Source: Winston Smith Labs: Global Oil Production and Consumption since 1965 [Interactive Map/Graph]


Worldwide Remittance Flows

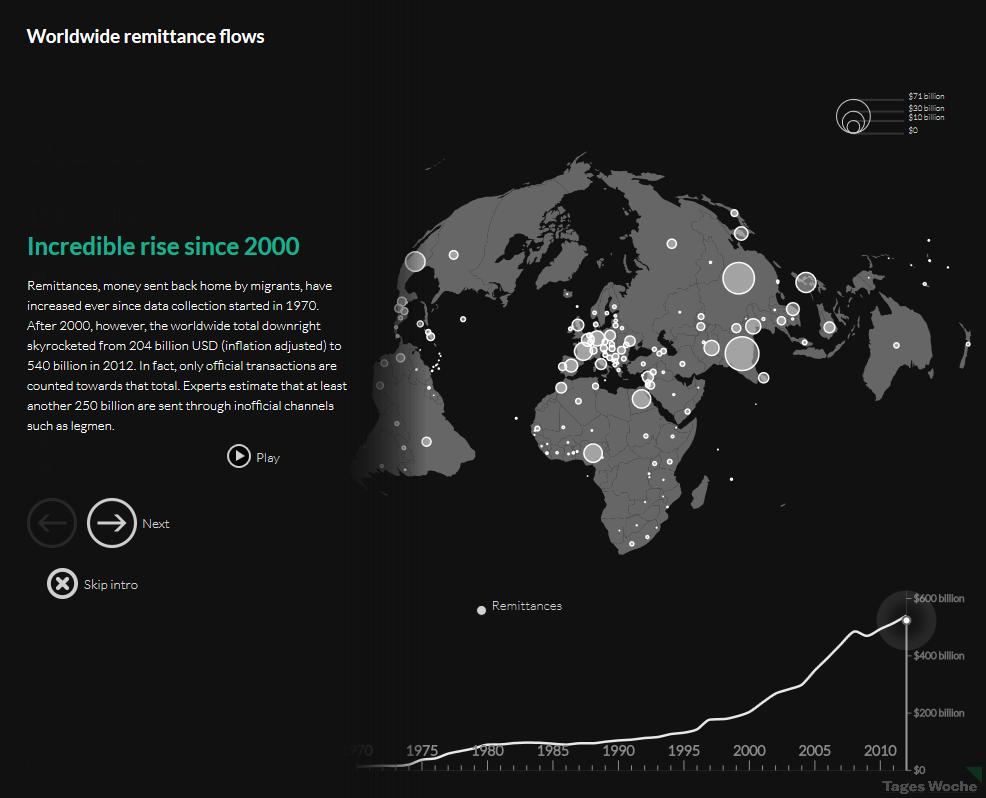
world remittance flows 2012Remittances, or money sent by migrant workers to their home countries, have increased since the year 2000. Although, they temporarily decreased after the economic crisis back in 2008, they recovered in 2010 and continued to rise. Remittances increased from $204 billion back in 2000 to $540 billion in 2012.

Countries with the highest remittance inflows include India ($71 billion), China ($62 billion), Mexico, the Philippines, Nigeria, Egypt, and France. Only nine countries saw a reduction in remittance inflows, among them Greece and Turkey which experienced the steepest decline.

For the interactive map, please visit: Tages Woche: The incredible rise of migrants’ remittances


The Failed States Index 2013

failed state index 2013Fund For Peace just released the Failed State Index (FSI) 2013. The FSI measures the level of risk in each country using a series of risk indicators such as mounting demographic pressures, massive movement of refugees, uneven economic development, poverty, legitimacy of the state, progressive deterioration of human services, violation of human rights, violation of the rule of law, security apparatus, intervention of external actors, etc. The FSI is calculated for a total of 178 countries.

Nations ranking at the top for failed states (red) include Somalia, Congo, Sudan, and South Sudan. Unfortunately, most of the world’s nations seem to be under a warning (orange) for failed states, from Africa to Asia to Latin America.

For the complete list of countries, rankings and scores, please visit: Fund For Peace: Failed State Index (FSI) 2013


Global Carbon Footprint by Country

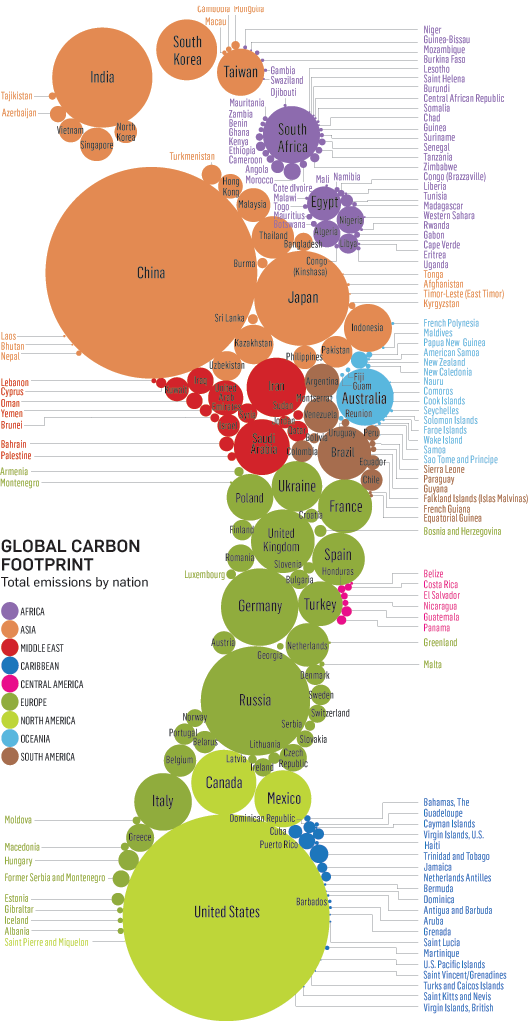
carbon footprint by countryThis original visualization by Stanford Kay shows total carbon emissions by country. Using different colors to differentiate each region, the size of the circle depicts the carbon footprint of each country.

Countries with the largest carbon footprint include China, United States, Russia, India, Japan, Germany, South Korea, Australia, UK, Iran, Saudi Arabia, Brazil, Taiwan, Ukraine, France, and Spain.


Extradition Treaties of the U.S. with Other Countries

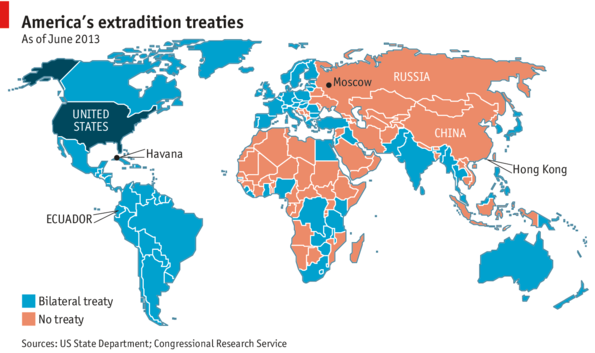
american extradition treatiesAn estimated 100 countries have signed bilateral extradition treaties with the United States, including all Latin American countries, Western European countries, Egypt, India, Australia, and New Zealand to name a few. Some 60 nations including China, Russia, several Middle Eastern and African countries have not. However, even if some countries signed extradition treaties they can still refuse to hand an individual over to the U.S. if that person is seeking asylum or if he/she would face the death penalty.

Source: The Economist: Daily Chart: Where can he go?


Global Acceptance of Homosexuality

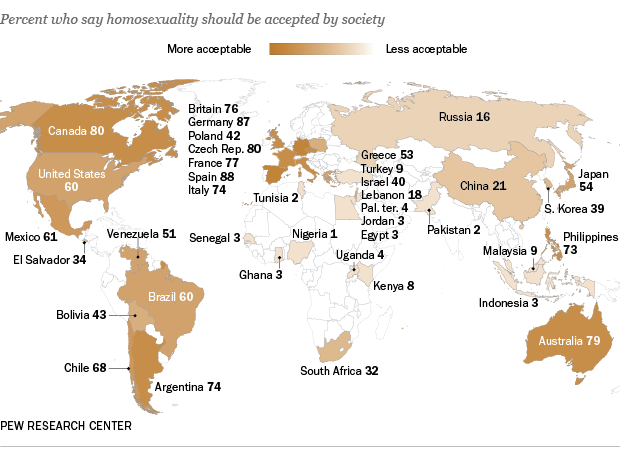
global homosexuality acceptanceIn light of the recent Supreme Court’s Defense of Marriage Act (DOMA) ruling in favor of same-sex marriage, we found this interesting visualization showing the global great divide among nations regarding the acceptance of homosexuality.

Countries where homosexuality is accepted include Spain (88%), Germany (87%), Czech Republic (80%) Canada (80%), Australia (79%), Philippines (73%), Argentina (74%), Italy (74%), Chile (68%), among others.

On the other side of the spectrum, there are countries where homosexuality is less acceptable, or not acceptable at all. Those countries include Nigeria (1%), Pakistan (2%), Tunisia (2%), Ghana (3%), Egypt (3%), Jordan (3%), Indonesia (3%), and Senegal (3%) to name a few.

Source: Pew Research Center: Global Acceptance of Homosexuality


Male and Female Literacy Rates by Country

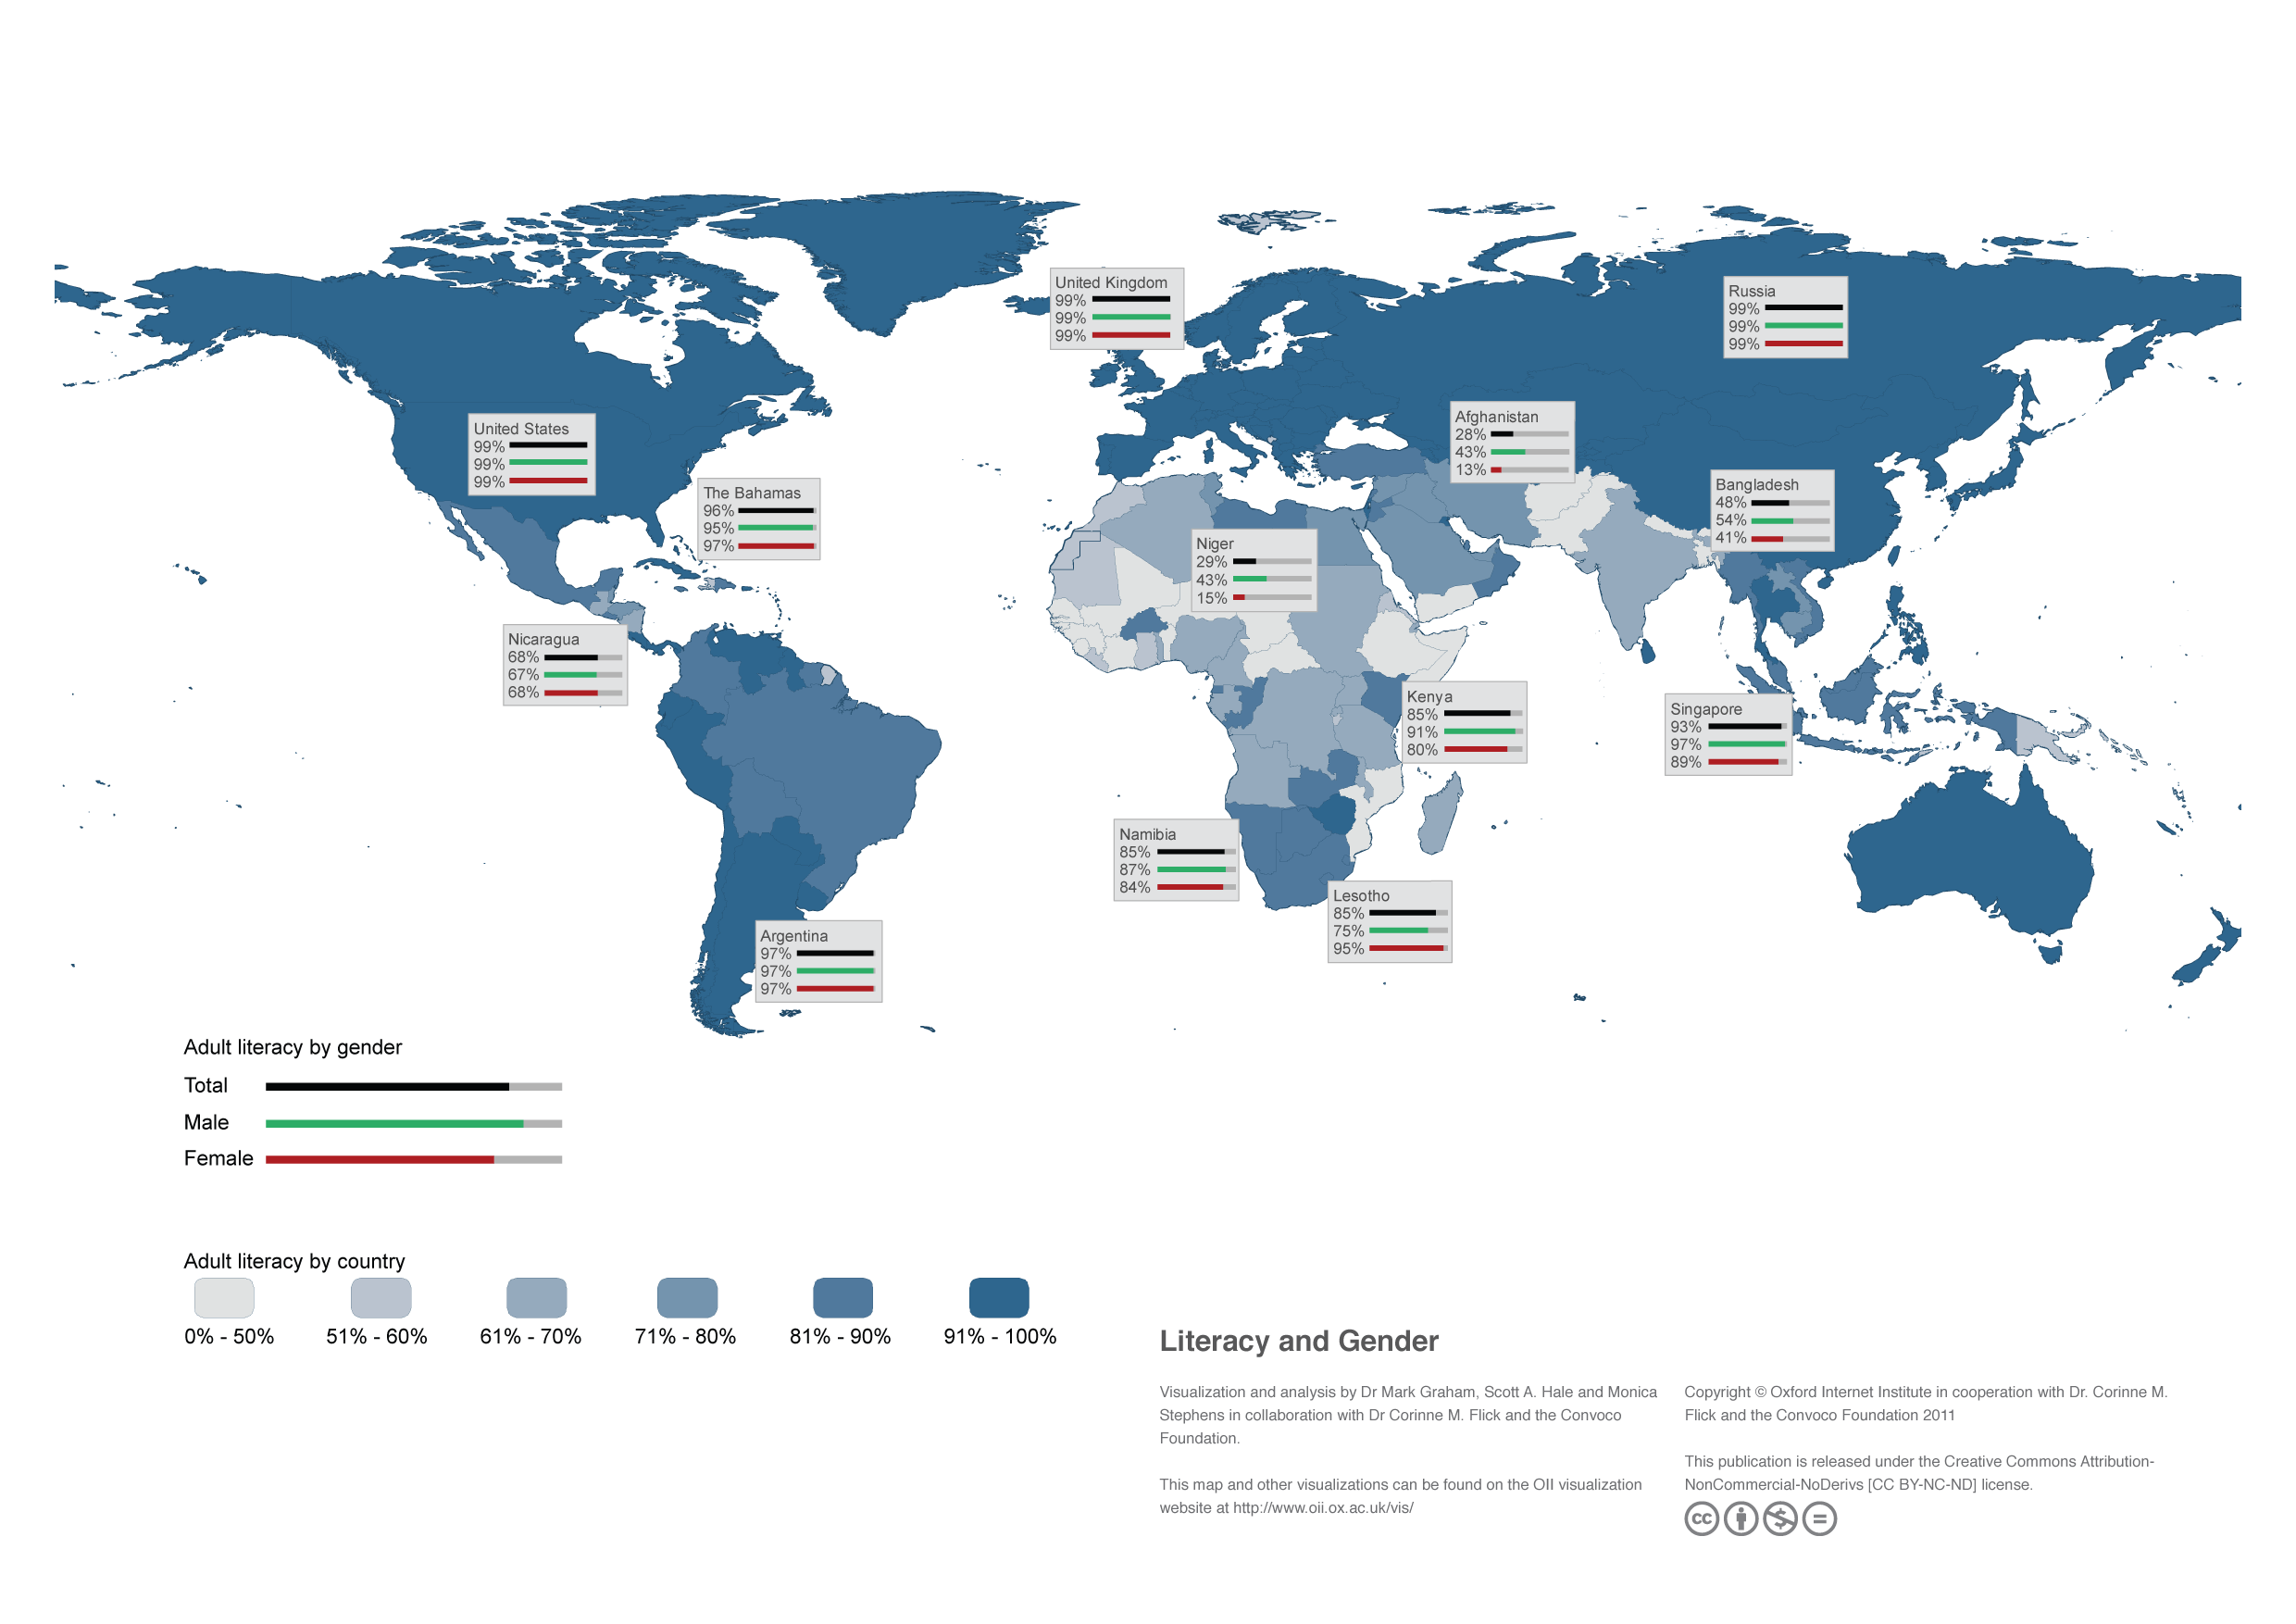
global literacy ratesLiteracy rate is defined as the number of people 15 years or older who can read and write. According to a study published by the Oxford Internet Institute at University of Oxford, global literacy rate is 82%. While the literacy rate for men is 87%, the rate for women is 77%.

Looking at data per continent, we find that countries in the Americas are highly literate, 99% for both men and women in the United States, and 97% for both men and women in Argentina. European countries show high literacy rates as well, above 91% for both men and women.

Many nations in Asia also show high literacy rates, except for countries like India, certain neighboring countries and countries in the Middle East, where the literacy rates are even lower for women.

Most African countries have very low literacy rates, with few exceptions: South Africa, Lesotho, Kenya, and Namibia.