Category Archives: China

Government Restrictions on Religion

Government Restrictions on Religion Around the World

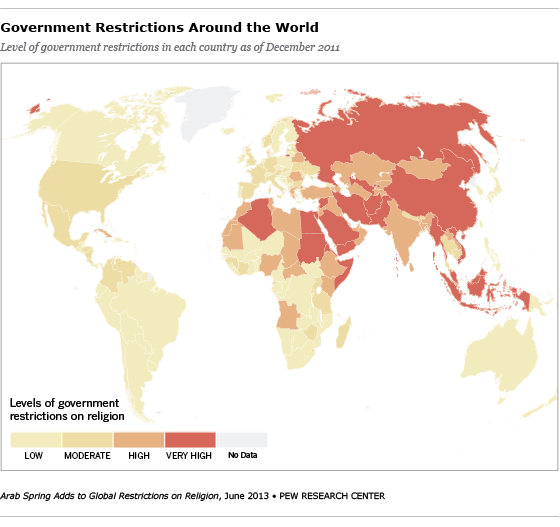
The Pew Research Center released today the results of its assessment of global restrictions on religion. A team of researchers combed through multiple sources of information to record concrete reports about government policies and actions, as well as specific incidents of religious violence or intolerance by social groups. One of the outcomes of the study is the thematic map shown above, which displays the level of government restrictions on religion as of December of 2011. The level is represented by the darkness of the color. The darker the color, the higher the level of government restrictions. The map shows that the Middle East and North Africa have many countries where governments restrict religion. Egypt, Saudi Arabia, and Iran top the list of countries with very high government restrictions. China, Indonesia, Pakistan, and Russia also stand out due to the policies and actions of their governments.

Child Labor Index 2012

2011_A4_Map_Template_V03Child labor is a serious problem that affects children all around the world. The International Labor Organization (ILO) defines child labor as “work that deprives children of their childhood, their potential and their dignity, and that is harmful to physical and mental development.” According to ILO, an approximate 215 million children around the world are working. Out of this number, 115 million are thought to be doing dangerous work in hazardous conditions. An estimated 150 million children between ages 5 and 14 are subjected to child labor globally.

According to the Child Labor Index for 2012 published by risk analysis company Maplecroft, countries with the highest risk of child labor violations include Myanmar, North Korea, Somalia, Sudan, Afghanistan, Pakistan, Russia, India, and China among a group of 76 countries.

Read full report at: Maplecroft: Conflict and economic downturn cause global increase in reported child labour violations – 40% of countries now rated ‘extreme risk’


Number of Deaths Caused by Air Pollution by Country

pollution deaths by 1000 populationOutdoor air pollution kills more than a million people every year globally. This map by the World Health Organization (WHO) shows the number of deaths caused by urban air pollution (UAP) per 1,000 people.

Based on data for 2002, the highest number of deaths caused by UAP occurred in Argentina and Uruguay in the Americas; Ukraine, Romania and Bulgaria in Europe; Iraq, Turkey, and Azerbaijan in Asia.


The United States vs. China

US and China compared - final graphicThe Guardian created this comparison of the U.S. and China, comparing several indicators such as GDP growth, GDP per capita, carbon emissions, exports, literacy rate, unemployment rate, military expenditure, outdoor pollution, to name a few.

The US is ahead of China in terms of literacy rate, number of internet users, military expenditure as a percentage of GDP, unemployment rate, GDP per capita, market capitalization, and social media. On the other hand, China is ahead of the U.S.  in terms of exports, GDP growth, number of people, carbon emission, and outdoor pollution.

While the U.S. has the largest deficit in its current account, China has the largest surplus.

Hunger Map 2012

mdg hunger map 2012One of the targets of the Millennium Development Goals (MDG) is to reduce the number of people with hunger by half by the year 2015. An estimated 870 million people still suffer from hunger around the world.

This map published by the Food and Agriculture Organization of the United Nations (FAO), shows that a good number of developing nations have made progress toward reaching that goal, as can be seen for the countries in green, with East Asia and Latin America as the top performers. On the other hand, many countries in Africa and West Asia have not made any progress, or worse, their situation has even deteriorated as can be seen for the countries in yellow or red.


Economic and Human Impact of Natural Disasters

economic and human impact of disastersThis visualization by the United Nations Office of Disaster Risk Reduction (UNISDR) shows the impact of natural disasters in the period 2000-2012.

Between 2009 and 2011 the economic cost of disasters increased from $50 billion to $371 billion due to the 2011 Great East Japanese Earthquake. The largest number of people killed occurred in the period 2009-2010, mainly due to earthquakes, including the 2010 Haiti earthquake. The largest number of people affected in the last twelve years occurred between 2001 and 2002, mainly due to droughts, including droughts in China and India.

Source: United Nations on Tumbler


World Production of Rare Earth Metals

the future global supply of rare earth elementsRare earth metals or rare earth elements are a collection of seventeen chemical elements located at the bottom of the periodic table. They are key elements in the manufacture of high technology components, hybrid cars, solar panels, lasers, electronics, etc.

As of 2010, China produced 97% of the total world production of rare earths, or 130,000 metric tons, followed by India (2%), Brazil (0.42%), and Malaysia (0.27%).

The estimated demand for rare earths for 2015 will increase 54% compared to the demand in 2010.

Source: GOOD: Infographic: The Future Global Supply of Rare Earth Elements

See also: IndexMundi: Commodities Glossary – Rare Earth Metals


Global Attitudes About the Economy

global attitudes about the economyA survey conducted by the Pew Research Center in 39 nations, regarding attitudes about the state of the economy in the respondents’ respective countries, yielded interesting results.

Respondents in emerging economies are the most optimistic. A median of 53% believe their economy is doing well, specially in China and Malaysia. In contrast, respondents in developed economies are the most pessimistic. A median of only 24% say their economy is doing well. European nations such as Greece, Italy, Spain, and France are the most pessimistic of all.

In the case of developing economies, some are somewhat optimistic (Philippines and Bolivia), and other not so much (Tunisia and Lebanon).

Source: Pew Research Global Attitudes Project: Widespread Dissatisfaction with Economy

Read full report: Pew Research Global Attitudes Project: Economies of Emerging Markets Better Rated During Difficult Times


Key Commodities and Emerging Markets

emerging market dominate commoditiesCommodities are raw materials essential for the production of more complex products. Commodities fall into three large categories: agricultural, energy, and metals.

According to this visualization, emerging economies (Brazil, Russia, India Indonesia, China, South Africa, etc.) have the largest reserves of certain key energy and metal commodities such as oil, coal, copper, cobalt, iron ore, molybdenum, nickel, zinc, and aluminum.

Source: Business Insider: 36 Maps That Explain The Entire World


The 50 Largest Ports in the World

worlds 50 largest portsEvery day finished goods and commodities are transported  by sea in shipping containers from one port to another across the globe. Standard shipping containers measure 20 feet long by eight feet wide, hence they receive the name of “Twenty-foot Equivalent Units” or TEUs.

The largest port in the world is in Shanghai (China) which saw a volume of 31.74 million TEUs of cargo freight passing through its port in 2011. Shanghai is followed by Singapore (Singapore) which saw a volume of 29.94 million TEUs passing through its port for the same year. Singapore is followed by Hong Kong, Shenzhen (China), Busan (South Korea), Ningbo, Guangzhou, and Qingdao (China), Dubai Ports (United Arab Emirates), and Rotterdam (Netherlands), all in the top ten.

For the interactive map, that allows you to explore each one of the largest 50 ports in the world, visit: The Smithsonian: Interactive: The 50 Largest Ports in the World