Category Archives: Egypt

Elimination of Chemical Weapons Worldwide

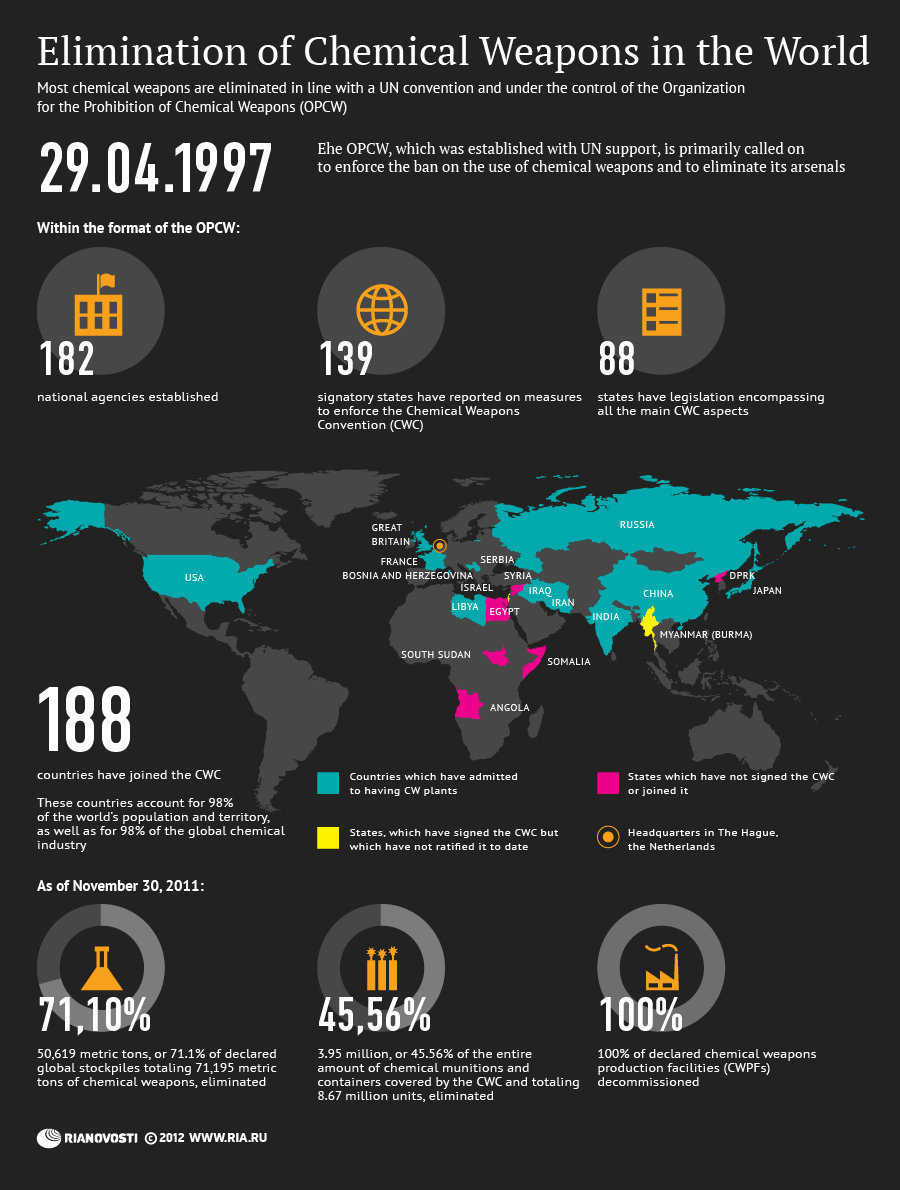
elimination of chemical weapons worldThe Organization for the Proliferation of Chemical Weapons (OPCW) was created to oversee the elimination of existing chemical weapons and monitor the chemical industry to prevent the production of additional chemical weapons. The OPCW was created in 1997 in The Hague, Netherlands, with support from the United Nations (UN).

The OPCW has 188 members states, signatories of the Chemical Weapons Convention (CWC). Nations that did not sign the CWC include Syria, Egypt, South Sudan, Somalia, Angola, and North Korea. Myanmar signed it, but it has not ratified it to date.

As of 2012, 71% of global stockpiles of chemical weapons have been destroyed, 46% of the total amount of chemical munitions have been eliminated, and 100% of the chemical plants producing chemical weapons have been decommissioned.

Source: Ria Novosti News Agency: Infographics – Elimination of Chemical Weapons in the World


Body Mass Index (BMI) by Country

A body mass index (BMI) between 18.5 and 24.9 is usually considered a healthy body weight to height relationship. A BMI of 25 or higher indicates body weight not optimal for the height of a particular person.

This visualization published by Visual.ly, shows the different BMI values for adult men and women across the globe.

Countries with a healthy average BMI between 20 and 22.9 include several nations in Africa, Yemen, India, Thailand, Japan, Pakistan, Singapore, among others.

Countries with an average BMI between 23 and 24.9 include several Asian nations, several European nations (including France), some nations in Africa, and Honduras.

Countries with an average BMI between 25 and 26.9 include Canada, Russia, Costa Rica, Colombia, Israel, Austria, Switzerland, Brazil, all Nordic countries, Spain, Portugal, and nations in the Middle East.

Countries with an average BMI of 27 and over  (the highest BMI range) include the United States, Kuwait, Cuba, Argentina, Chile, Bolivia, Peru, Venezuela, Australia, UK, New Zealand, Greece, and Germany to name a few.


Fossil Fuel Subsidies Globally

Fossil fuel subsidies are very common in developing nations. Subsidies cover the difference between the price at which fossil fuels are sold inside the country and their actual price in international markets, creating a huge fiscal burden (an estimated $400 billion annually) for the countries that provide them. Developing nations with fossil fuel subsidies include: Venezuela, Argentina, Ecuador, Algeria, Libya, Egypt, Kuwait, Iran, Pakistan, Russia, China, India, Indonesia, etc.

Developed nations also provide subsidies in the form of tax breaks to the oil industry and other measures (estimated at a cost of $45 to $75 billion per year). Nations in this group include many OECD (Organization for Economic Co-operation and Development) members.

For the interactive map, visit: National Geographic: The Great Energy Challenge: Fossil Fuel Burden on State Coffers


Food Exports and Imports Worldwide

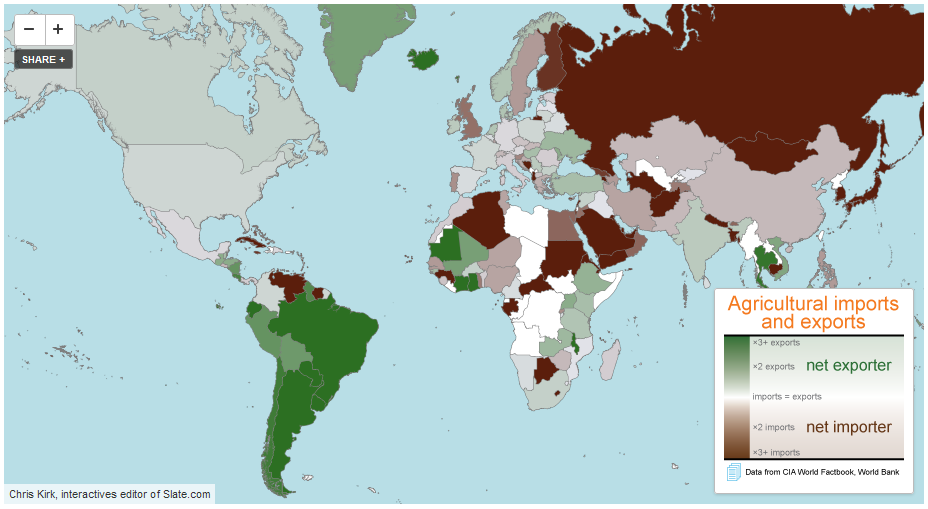
Some countries are net exporters of food (their food exports are larger than their food imports) while others are net importers of food (their food imports are larger than their food exports).

Among the net exporters of food we find the majority of South American countries, with the exception of Venezuela and Suriname, the United States, Canada, Mauritania, Indonesia, Australia, and a few African countries such as Mauritania, Ivory Coast and Ghana. The largest net exporter of food, by far, is Argentina with $23.42 of food exports per every $1.00 of food imports. Argentina is followed by Brazil, New Zealand, Paraguay and Iceland.

Among the net importers of food we find countries such as Russia, Finland, Sweden, the UK, Italy, Germany, Portugal, Sudan, Cuba, Saudi Arabia, Japan, etc. The largest net food importer is Eritrea, with $0.01 of food exports per every $1.00 of food imports. Eritrea is closely followed by Venezuela, Turkmenistan, and Algeria.

Data for for both agricultural exports and imports are for 2010.

Source: Slate.com: Maps: Agriculture in the U.S. and Around the World


Journalism: A Dangerous Profession

Journalism is a very dangerous profession. Many journalists are killed every year around the world while covering everything from business and sports to revolutions, wars, political upheavals, corruption, human rights violations and more.

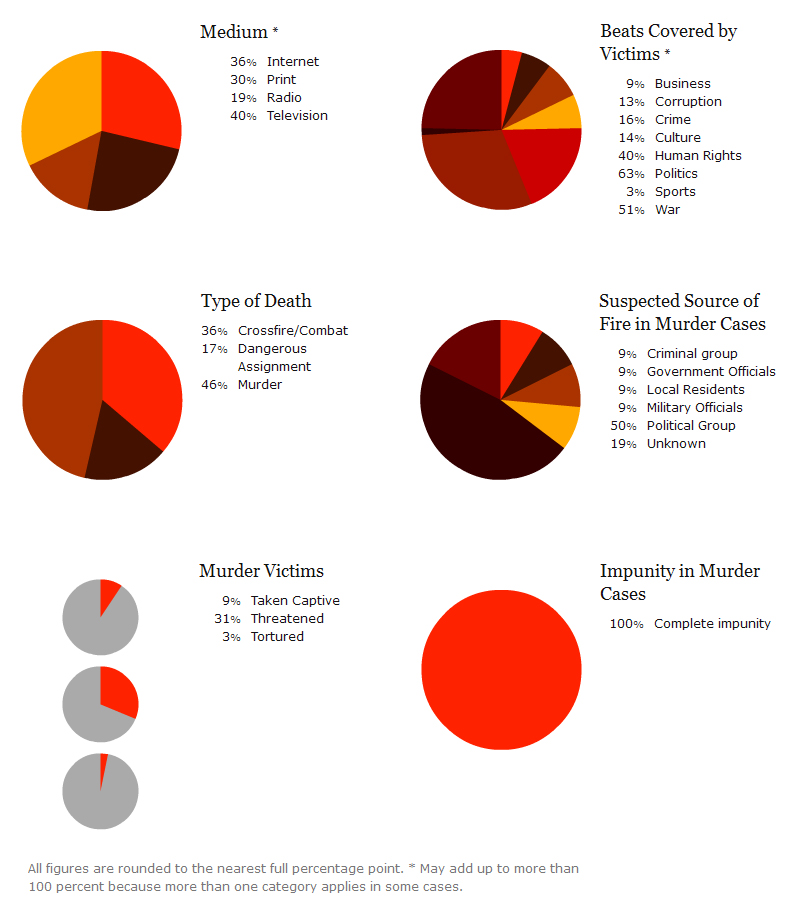
In 2012 alone, 103 journalists were killed around the globe. Motives were confirmed for 70 of them. The deadliest countries for journalists in 2012 were Syria (28 deaths), Somalia (12 deaths), Pakistan (7 deaths), and Brazil (4 deaths). The motives where the confirmed in these cases.

The way journalists are killed, range from crossfire or combat to murder. Impunity is a shocking 100% for murder cases. More detail in the chart below:

For additional information, including the list of the journalists killed in 2012, visit: Committee to Protect Journalists: 70 Journalists Killed in 2012/Motive Confirmed


Political Rights and Civil Liberties Around the World for 2012

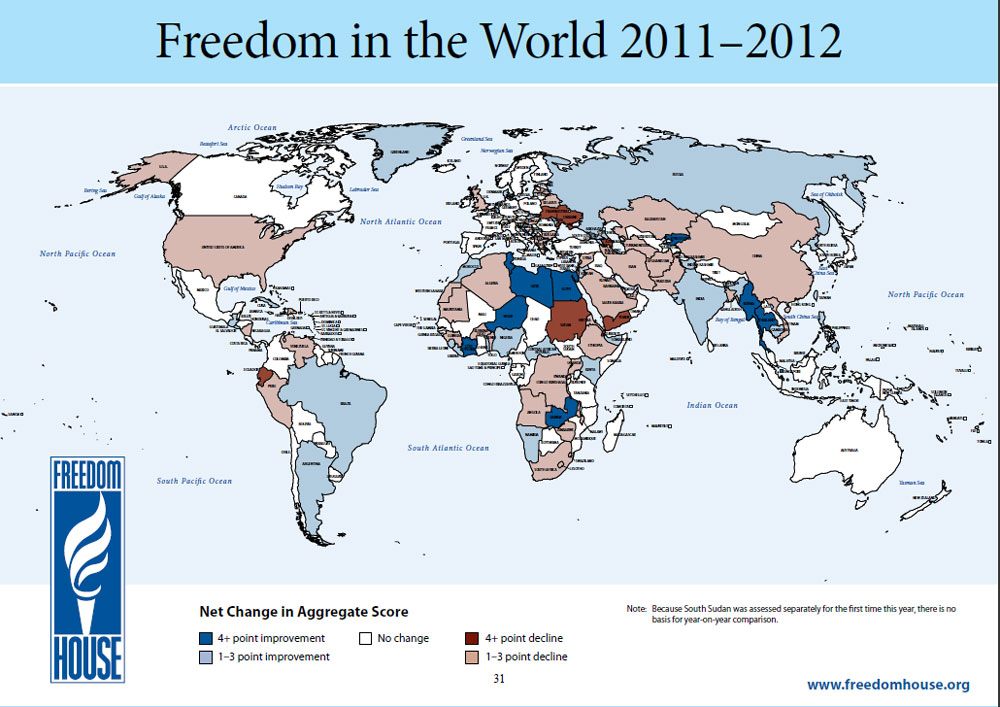
2011 and 2012 have been years full of changes in the level of political rights and civil liberties around the world, primarily due to the Arab uprisings. Freedom House, an organization that supports democratic change, monitors freedom, and advocates for democracy and human rights around the world, has identified which countries have improved and which countries have declined in their level of freedom. The Freedom House Index (FHI) designates countries and territories included in the index as “free”, “partly free”, and “not free”.

As shown in the map above, Egypt, Libya, Tunisia and Burma are among the countries that have improved the most, while Ecuador, Sudan and Yemen are among the worst performers.

Internet traffic from Libya

I thought it would be interesting to share a snapshot of our traffic graphs to show how Internet access to our site has been affected during the uprisings in the Middle East. Let’s start with a graph showing visits from Tripoli, the capital of Libya.

Tripoli City Detail- - Google Analytics

The graph above shows that access to the Internet in Tripoli has been virtually non-existent since February. It will be interesting to see how fast traffic recovers once it gets restored.

Contrast the graph above to the traffic chart for Cairo (Egypt):

Cairo City Detail- - Google Analytics

As shown above, visits from Cairo dipped considerably for a few days at the end of January / beginning of February, but it recovered fairly quickly once Mubarak stepped down.

The final graph I wanted to share is for Tunis, the capital of Tunisia:

Tunis City Detail- - Google Analytics

It is remarkable that visits from Tunis were largely unaffected despite the turmoil that started in December 2010 and continued until the ouster of President Ben Ali on January 14th, 2011.