Category Archives: India

Wealth Comparison for the Years 1500 and 2015

wealth year 1500

wealth year 2015
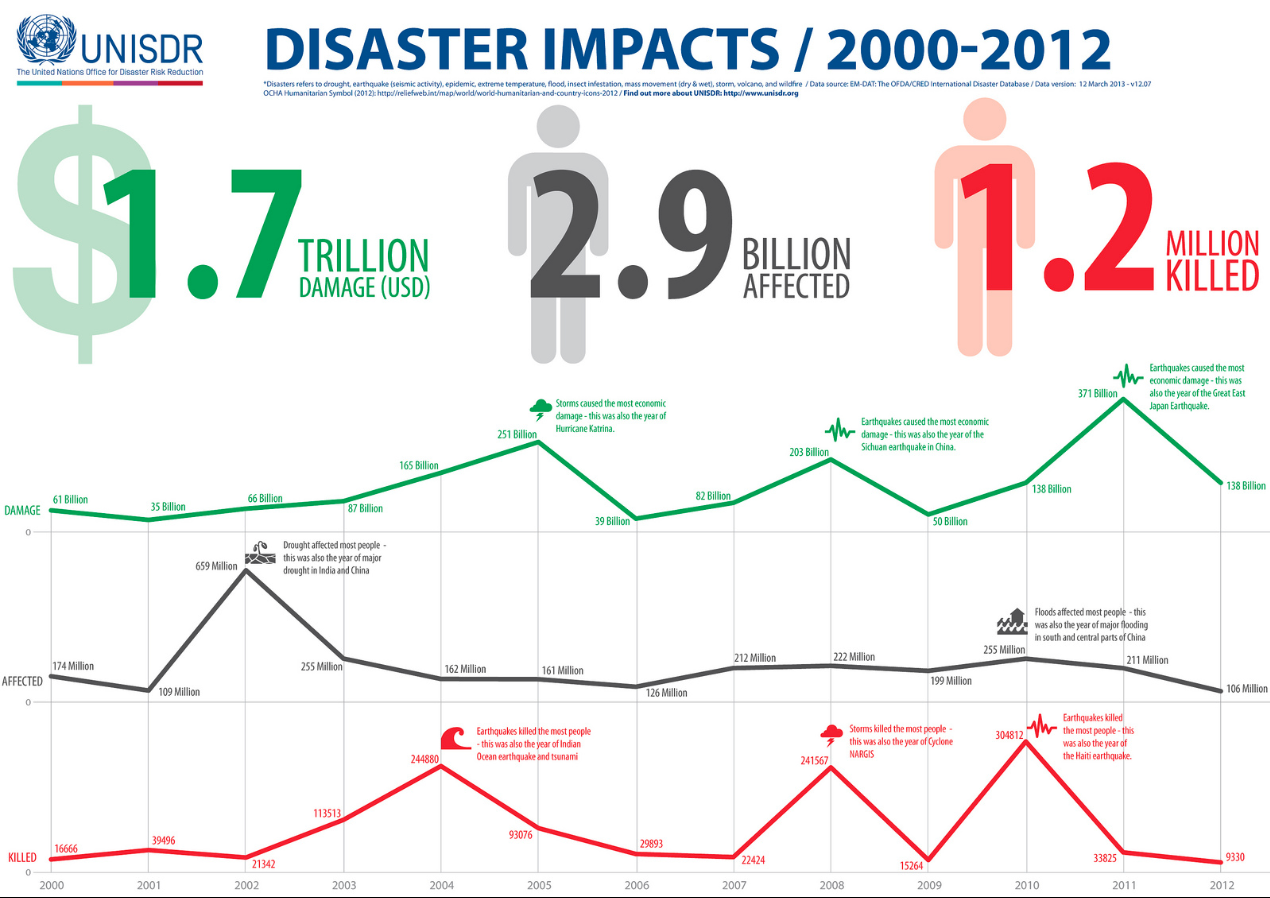
Comparing the levels of wealth per person for the years 1500 and 2015, as shown in these two maps, it is interesting to see how economic power has shifted from some nations to others.

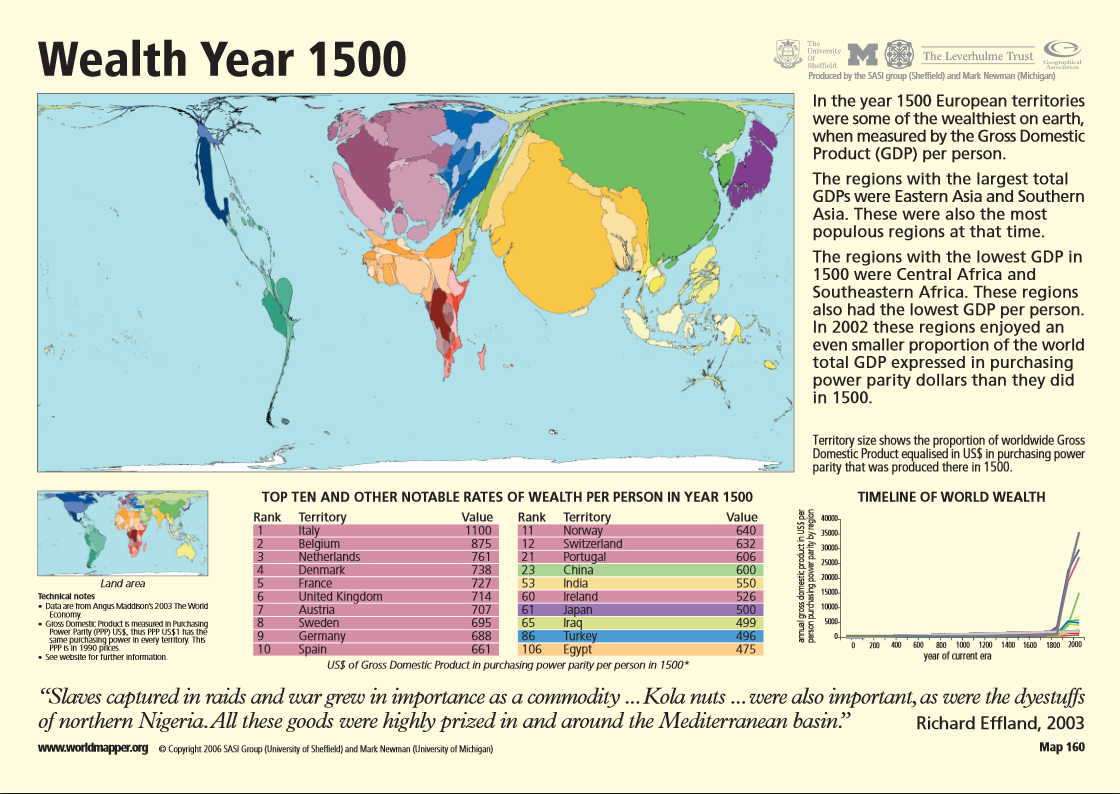
Back in the 1500s, economic power was held by a majority of European nations leaded by Italy. China ranked number 23, India 53, and Japan 61. North America’s wealth was negligible compared to Europe’s, but the African region enjoyed more wealth than they do today.

A forecast for the year 2015 places Taiwan, Hong Kong, and Singapore at the top in GDP per capita. Some European nations are still wealthy, such is the case of Malta, Luxembourg, Norway, and Ireland, but Italy is not in the lead anymore. Japan’s wealth per capita has increased, and so has the United States’, but the wealth of African countries has become the lowest worldwide.

Source: Global Finance: Wealth Distribution and Income Inequality by Country


Economic and Human Impact of Natural Disasters

economic and human impact of disastersThis visualization by the United Nations Office of Disaster Risk Reduction (UNISDR) shows the impact of natural disasters in the period 2000-2012.

Between 2009 and 2011 the economic cost of disasters increased from $50 billion to $371 billion due to the 2011 Great East Japanese Earthquake. The largest number of people killed occurred in the period 2009-2010, mainly due to earthquakes, including the 2010 Haiti earthquake. The largest number of people affected in the last twelve years occurred between 2001 and 2002, mainly due to droughts, including droughts in China and India.

Source: United Nations on Tumbler


World Production of Rare Earth Metals

the future global supply of rare earth elementsRare earth metals or rare earth elements are a collection of seventeen chemical elements located at the bottom of the periodic table. They are key elements in the manufacture of high technology components, hybrid cars, solar panels, lasers, electronics, etc.

As of 2010, China produced 97% of the total world production of rare earths, or 130,000 metric tons, followed by India (2%), Brazil (0.42%), and Malaysia (0.27%).

The estimated demand for rare earths for 2015 will increase 54% compared to the demand in 2010.

Source: GOOD: Infographic: The Future Global Supply of Rare Earth Elements

See also: IndexMundi: Commodities Glossary – Rare Earth Metals


The Most and Least Racially Tolerant Countries

racial-tolerance-mapA survey conducted by two Swedish economists asked respondents in 80 countries what kind of people they would not like as neighbors, to which many replied “people of a different race”.

The results from that survey are displayed in this map published by the Washington Post. According to the survey, people in English-speaking, Scandinavian, and Latin American countries are the most racially tolerant, with the exception of Venezuela. South Africa shows to be a tolerant country, while the attitudes in Europe show a lot of variation. People in countries such as France, Turkey, India, Jordan, Saudi Arabia, Egypt, Nigeria, South Korea, and Indonesia are the least racially tolerant.


Key Commodities and Emerging Markets

emerging market dominate commoditiesCommodities are raw materials essential for the production of more complex products. Commodities fall into three large categories: agricultural, energy, and metals.

According to this visualization, emerging economies (Brazil, Russia, India Indonesia, China, South Africa, etc.) have the largest reserves of certain key energy and metal commodities such as oil, coal, copper, cobalt, iron ore, molybdenum, nickel, zinc, and aluminum.

Source: Business Insider: 36 Maps That Explain The Entire World


The 50 Largest Ports in the World

worlds 50 largest portsEvery day finished goods and commodities are transported  by sea in shipping containers from one port to another across the globe. Standard shipping containers measure 20 feet long by eight feet wide, hence they receive the name of “Twenty-foot Equivalent Units” or TEUs.

The largest port in the world is in Shanghai (China) which saw a volume of 31.74 million TEUs of cargo freight passing through its port in 2011. Shanghai is followed by Singapore (Singapore) which saw a volume of 29.94 million TEUs passing through its port for the same year. Singapore is followed by Hong Kong, Shenzhen (China), Busan (South Korea), Ningbo, Guangzhou, and Qingdao (China), Dubai Ports (United Arab Emirates), and Rotterdam (Netherlands), all in the top ten.

For the interactive map, that allows you to explore each one of the largest 50 ports in the world, visit: The Smithsonian: Interactive: The 50 Largest Ports in the World


Elimination of Chemical Weapons Worldwide

elimination of chemical weapons worldThe Organization for the Proliferation of Chemical Weapons (OPCW) was created to oversee the elimination of existing chemical weapons and monitor the chemical industry to prevent the production of additional chemical weapons. The OPCW was created in 1997 in The Hague, Netherlands, with support from the United Nations (UN).

The OPCW has 188 members states, signatories of the Chemical Weapons Convention (CWC). Nations that did not sign the CWC include Syria, Egypt, South Sudan, Somalia, Angola, and North Korea. Myanmar signed it, but it has not ratified it to date.

As of 2012, 71% of global stockpiles of chemical weapons have been destroyed, 46% of the total amount of chemical munitions have been eliminated, and 100% of the chemical plants producing chemical weapons have been decommissioned.

Source: Ria Novosti News Agency: Infographics – Elimination of Chemical Weapons in the World


Crude Oil Exports and Imports by Country

crude net balance by countryVast quantities of crude oil are exported and imported each year. Some countries are net exporters (their oil exports are larger than their oil imports), and some are net importers (their oil imports are larger than their exports).

In this visualization by Data Driven Consulting, we can see that the United States was the largest net importer of crude oil in 2009. Other net importer countries include China, India, Japan, South Korea, Germany, Belgium, Italy, UK, Spain, Singapore, and Australia.

Among the net exporters of crude oil we find Russia, Saudi Arabia, Iran, Iraq, Norway, Venezuela, Mexico, and Canada.

For the full-size interactive dashboard, visit: Tableau Public: Exporters and Importers


Total Carbon Emissions by Country

The Kyoto Protocol is an international treaty that seeks the reduction of greenhouse gases that contribute to global warming by setting emission reduction targets for industrialized nations. The Kyoto Protocol was signed on December 11, 1997 in Kyoto (Japan) by 191 countries. The United Stated signed the treaty, but later it did not ratify it.

This visualization by The Guardian shows total carbon emissions by country between 1997 and 2007, ten years since the protocol was signed.

The United States is the country that has produced the largest amount of carbon emissions (64,166 million tonnes) in the period 1997-2007 followed by China, Russia, Japan, India, and Germany.

Asia and Oceania combined are the regions with the highest carbon emissions produced in the same period (96,306 million tonnes). Asia and Oceania are followed by North America (U.S., Canada, and Mexico) with carbon emissions of the order of 74,867 million tonnes, and Europe with carbon emissions at 50,370 million tonnes as of 2007.


Body Mass Index (BMI) by Country

A body mass index (BMI) between 18.5 and 24.9 is usually considered a healthy body weight to height relationship. A BMI of 25 or higher indicates body weight not optimal for the height of a particular person.

This visualization published by Visual.ly, shows the different BMI values for adult men and women across the globe.

Countries with a healthy average BMI between 20 and 22.9 include several nations in Africa, Yemen, India, Thailand, Japan, Pakistan, Singapore, among others.

Countries with an average BMI between 23 and 24.9 include several Asian nations, several European nations (including France), some nations in Africa, and Honduras.

Countries with an average BMI between 25 and 26.9 include Canada, Russia, Costa Rica, Colombia, Israel, Austria, Switzerland, Brazil, all Nordic countries, Spain, Portugal, and nations in the Middle East.

Countries with an average BMI of 27 and over  (the highest BMI range) include the United States, Kuwait, Cuba, Argentina, Chile, Bolivia, Peru, Venezuela, Australia, UK, New Zealand, Greece, and Germany to name a few.