Category Archives: Countries

Rape Statistics by Country

click to enlarge

The UN Office on Drugs and Crime compiles rape statistics from countries around the world. We used their most recent numbers to create the map displayed above, which shows the number of rapes reported to police per 100,000 inhabitants. According to the UN data, the country with the highest rate of reported rapes is Botswana (92.9), while the country with the lowest rate is Egypt (0.1). Note though that comparison of crime rates across countries needs to be be taken with a grain of salt, since in some countries the population may be reluctant to report certain types of crimes to the police. You can read more about how the UN compiles crime statistics at its website.

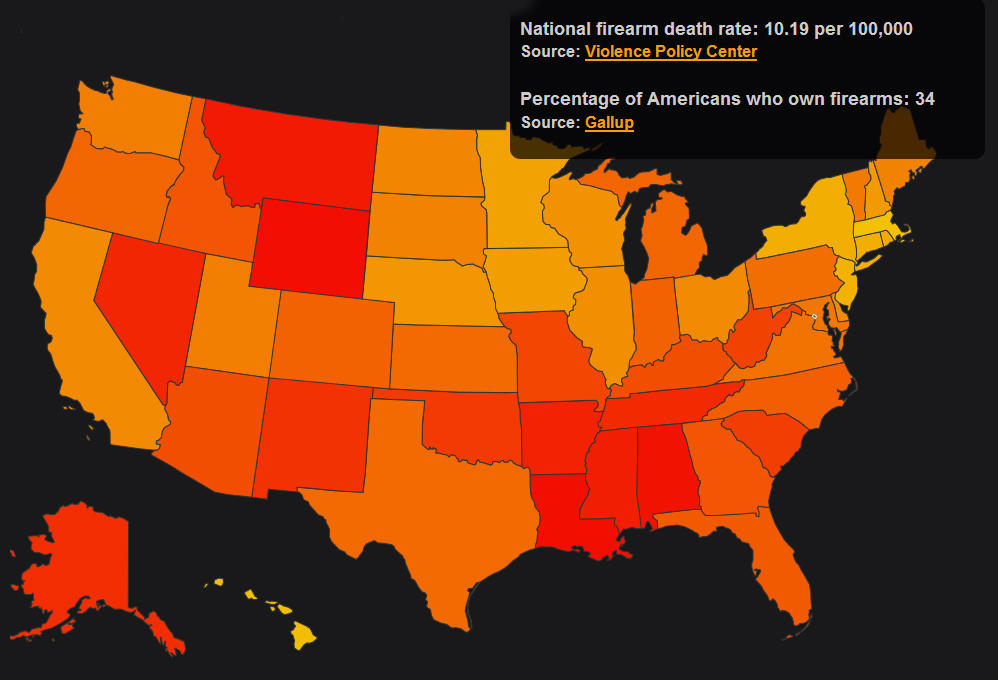
 

Gun-Related Deaths vs. Gun Ownership in the U.S.

click to enlarge

According to data from The Violence and Policy Center, the death rate by firearms in the U.S. is 10.19 per 100,000 people. Data from Gallup puts gun ownership at 34% nationwide. States with higher percentage of gun ownership also show a high number of deaths by firearms. Louisiana ranks 1 in number of deaths by firearms at 18.03 per 100,000, and 13 in gun ownership at 45.6%. Wyoming ranks 2 in number of deaths by firearms at 17.64 per 100,000, and 2 in gun ownership at 62.8%. These states are followed by Montana, Mississippi, Arkansas, Nevada, Tennessee and Alaska. In comparison, Massachusetts ranks 50 in number of deaths by firearms at 3.14 per 100,000 (lowest of all fifty states), and 48 in gun ownership at 12.8%. Hawaii fares well, ranking 49 in number of deaths by firearms, and 50 in gun ownership at 9.7% (the lowest of all fifty states).

See interactive map at: Aljazeera.com – Interactive: US, Yemen lead the world in guns


United Kingdom Facts

United Kingdom Facts

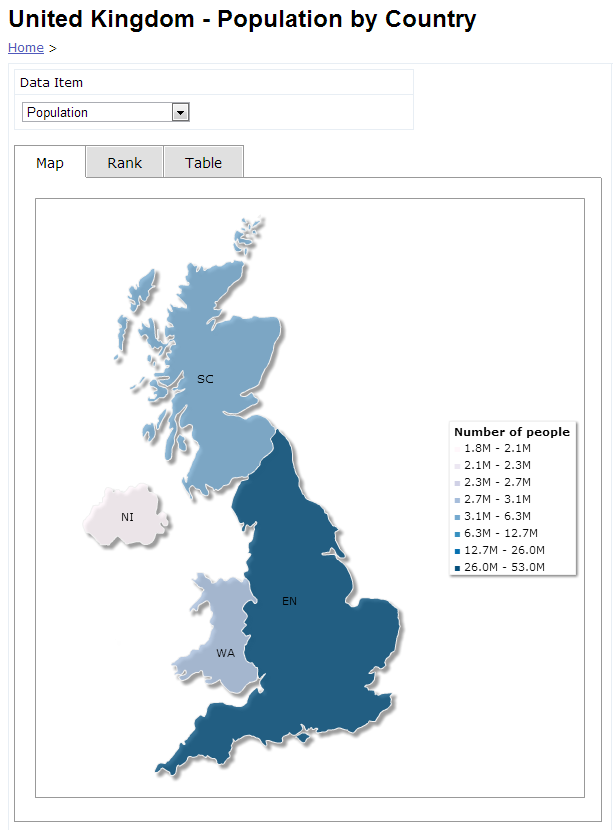
We just launched a new section with facts about the United Kingdom, its countries, and regions. We started with basic population indicators; we’ll be adding additional indicators over the coming weeks. Click on the following links to explore the thematic maps, ranking charts, and data tables we have so far:

Sexual Well-Being Around the World

click to enlarge

Durex, the condoms manufacturing company, conducted a survey of 26,000 people in 26 countries, asking about their sexual well-being. The results are summarized in an interactive map that allows you to see how each participant countries rates in terms of frequency of sex versus sexual satisfaction levels. For Nigeria, for example, 53% of respondents were having sexual intercourse weekly, with 67% reported being satisfied. For Greece, 87% of respondents were having sexual intercourse weekly, with 51% being satisfied. For Japan, 34% of respondents were having sexual intercourse weekly, the lowest amongst the participant countries, with only 15% being satisfied, also the lowest rate of the surveyed populations.

For the interactive map, visit: Durex: Sexual Wellbeing Survey – Frequency of Sex versus Satisfaction Levels


The Happiest Countries on Earth

click to enlarge

MIT’s Technology Review magazine created a map of the 40 happiest countries in the world, based on research data from Columbia University’s Earth Institute. According to the list, Denmark ranks as the happiest country, followed by Finland, Norway, the Netherlands and Canada. At the bottom of this list are Jamaica, Argentina, Trinidad and Tobago, Guatemala and the Czech Republic. Countries not on this list ranked even lower.

For a detailed information concerning the methodology used and sources, see: The Earth Institute – Columbia University: First World Happiness Report Launched at the United Nations


How Far Are You From the Nearest McDonald’s?

click to enlarge

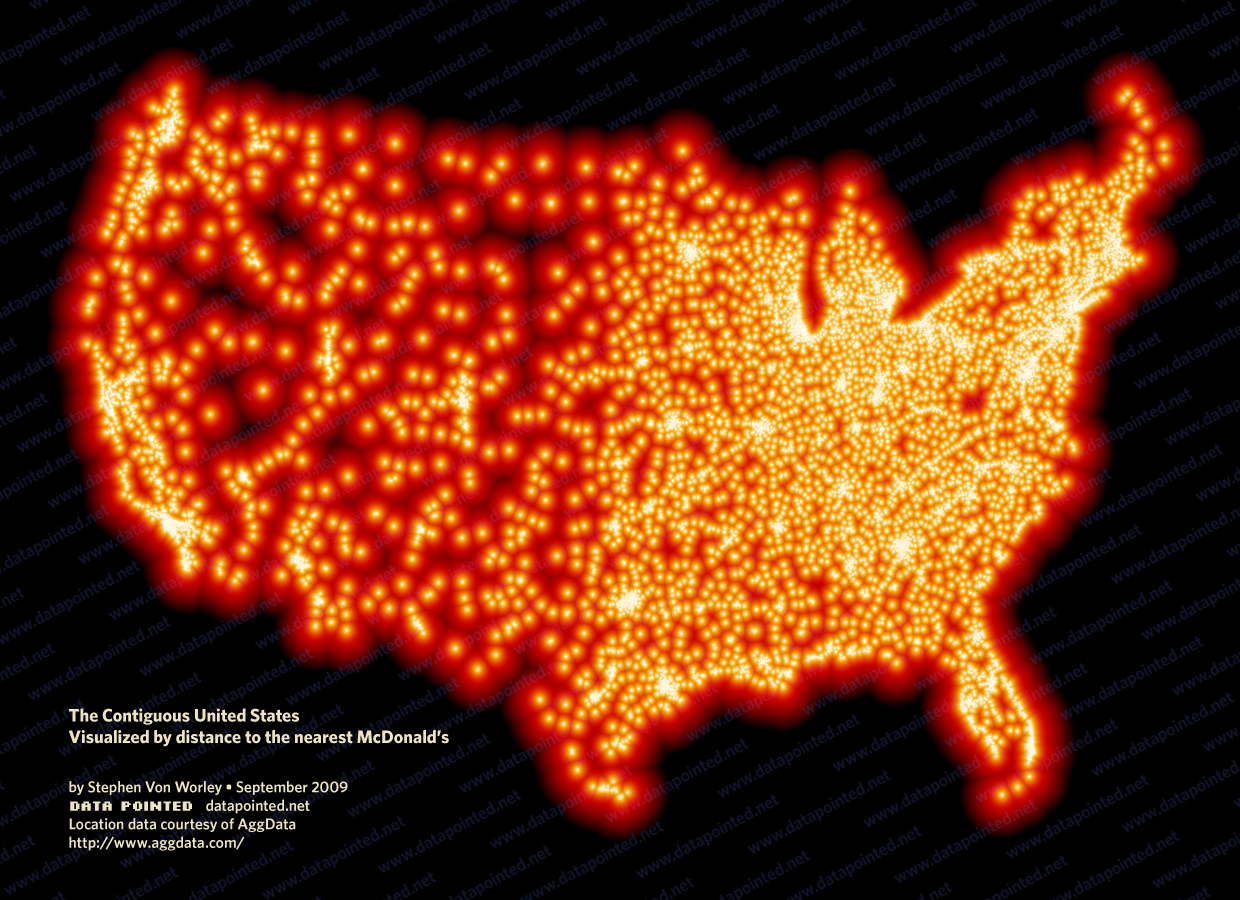
According to this map, you cannot get too far away from a McDonald’s fast food chain store, at least not in the Eastern half of the United States. These restaurants tend to concentrate around populated centers and along highways.

This map, showing the distance to the nearest McDonald’s store, was based on a list of more than 13,000 stores located in the continental U.S.

For more detail, see: Data Pointed: Where The Buffalo Roamed – How Far Can You Get From McDonald’s?


The Most Corrupt Countries in the World

click to enlarge

The Corruption Perceptions Index (CPI) just released for 2012 by Transparency International ranks 176 nations according to the perceived corruption levels of their public institutions. The CPI uses a scale of 0-100, 0 being the most corrupt and 100 the least corrupt. For 2012 the most corrupt countries, ranking at the bottom with a score of 8, are Somalia, North Korea and Afghanistan. At the other end of the spectrum, ranking at the top with a score of 90 are Denmark, Finland and New Zealand.

The CPI is a composite index based on a combination of surveys and assessments of corruption compiled by different reputable institutions worldwide.

See complete report: Transparency International – 2012 Corruption Perceptions Index


Terrorism Around the World

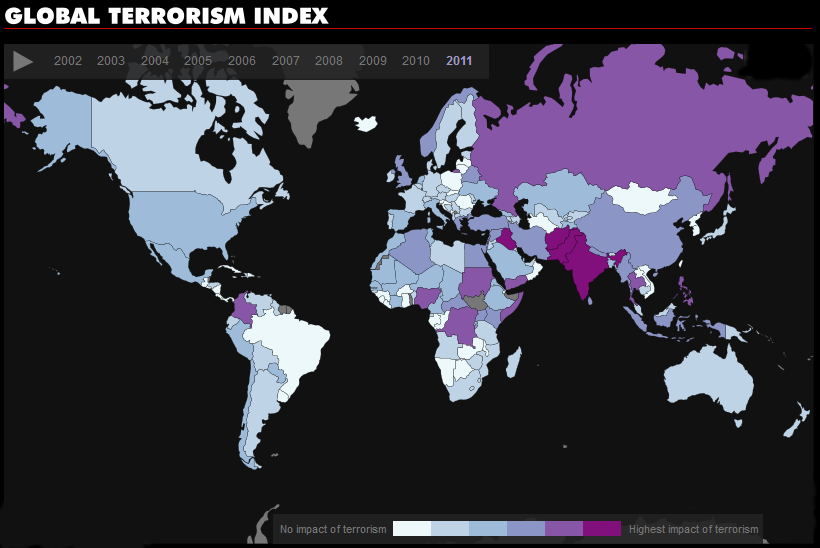
The Global Terrorism Index (GTI) ranks 158 countries based on the impact of terrorism in each of these countries. The rankings goes from 1 to 10, 1 being the lowest impact of terrorism and 10 the highest impact of terrorism. For 2011, the countries ranked at the top are Iraq, Pakistan, Afghanistan and India, followed by Yemen, Somalia, Nigeria, Thailand, Russia, the Philippines, Sudan, the Democratic Republic of Congo, Colombia and Syria.

The GTI uses four indicators to measure the impact of terrorism: number of incidents, number of deaths, injuries and property damage. A five year weighted average is also used in order to measure the lasting impact of terrorism in a particular country.

For more details see: Vision of Humanity – Global Terrorism Index


Pop, Soda or Coke?

click to enlarge

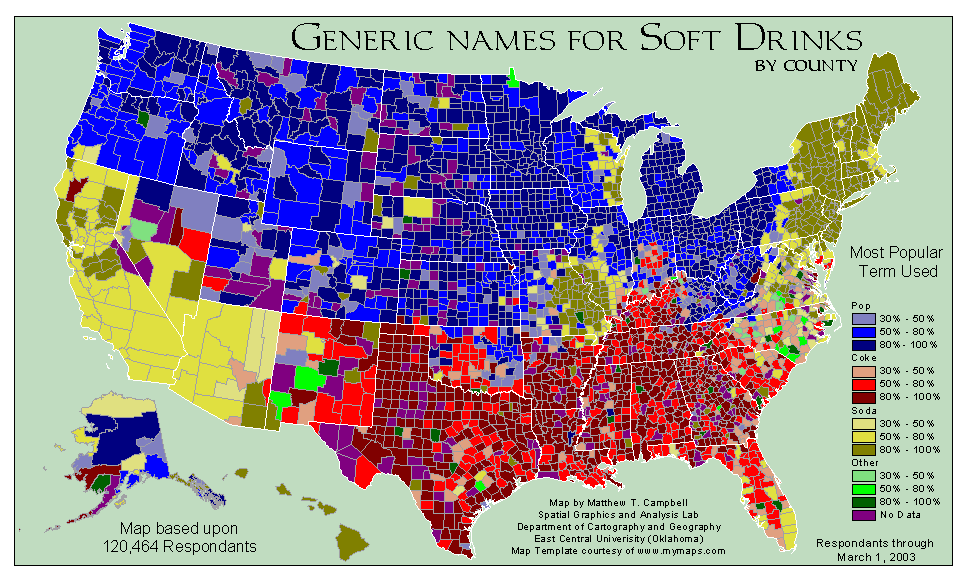
According to this map by the Department of Cartography and Geography of the East University in Oklahoma, people have different names for soft drinks in different areas of the United States. Soda is the name used in California, Nevada, Arizona, and parts the North East region. Pop is the name referred to in the Northern half of the U.S. and Coke is the popular name used in the Southern states. This map was based upon 120,464 respondents.


Colombian Coal

We recently added Colombian coal to the list of commodities that we track in our commodities section. You can now analyze the average monthly price of Colombian coal for the past 30 years, as seen in the graph below.

Coal, Colombia - Monthly Price - Commodity Prices - Price Charts, Data, and News - IndexMundi

In addition to monthly price data, we also have production, consumption, exports, and imports of Colombian coal in terms of quantity, and value in dollars of Colombian coal exports and imports.