Category Archives: Countries

Bleak Estimates for Corn Yields and Grain Stocks for 2012

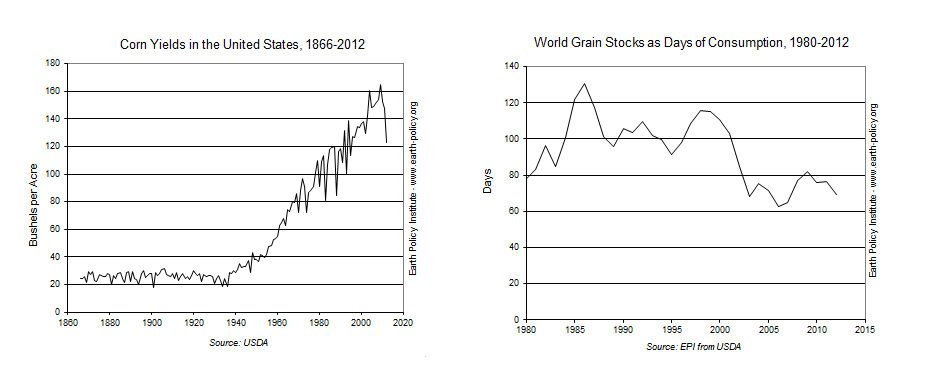
According to the Earth Policy Institute, drought conditions have generated bleak corn yield estimates for the remainder of 2012. Corn yields for September 2012 are estimated at 123 bushels per acre, which would make it the lowest yield since 1995. Compare this yield to the highest ever value of 165 bushels per acre, which was last reached in 2009.

As a consequence, the price of corn has increased significantly. It reached a record high of $8 per bushel in the corn futures market back in July, and has fluctuated around that price since then. Another consequence is the expected fall in global grain supplies. Supplies are expected to fall to 432 million tons, or 69 days of global consumption.
Poverty in the U.S.

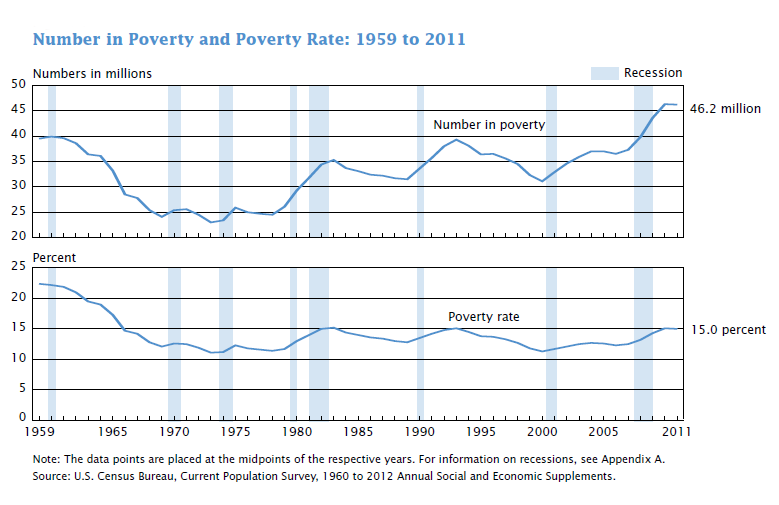
According to data just released by the U.S. Census Bureau, 15% of the population lives in poverty, that is 46.2 million of people. Those numbers are not statistically different from the 2010 estimates. In 2011 the poverty threshold for a family of four was $23,021.

The poverty rate for males decreased between 2010 and 2011 to 13.6%, and remained the same for females at 16.3%. The poverty rate for Hispanics declined between 2010 and 2011. By age, the group with the highest poverty rate was that of children under 18 at a rate of 21.9%. By region, the only region to show a significant change was the South with a decline in the poverty rate from 16.8% to 16.0%. Read more…


Will China Dominate the World Beer Market?

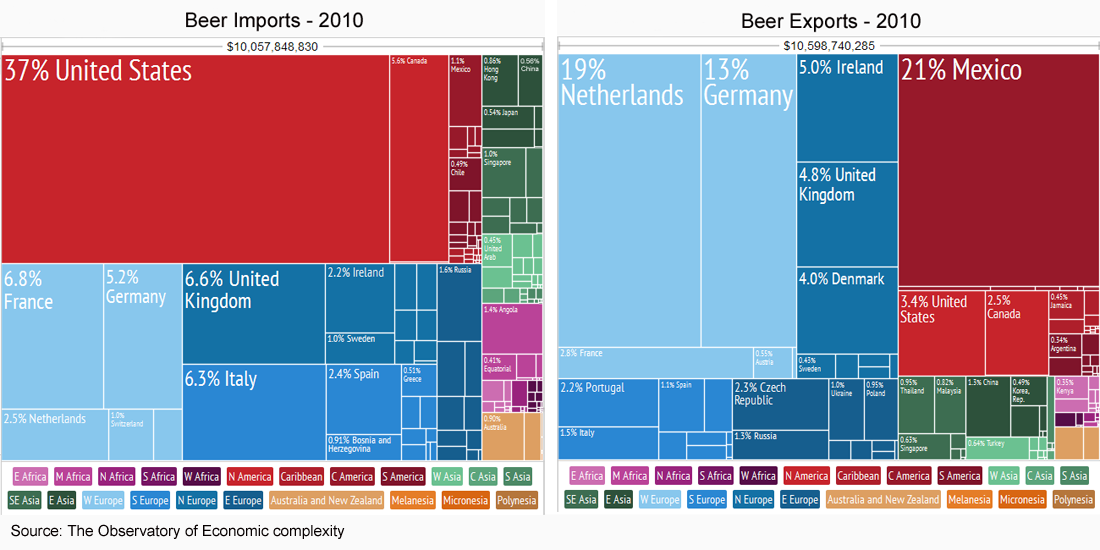
According to a report by the Kirin Institute of Food and Lifestyle, in 2010 China remained the largest consumer of beer for the eight consecutive year. China’s beer consumption increased 5.9% with respect to 2009, with a share of 24.5% of total world beer consumption.

In the world trade arena, though, China is still a small player. China’s imports of beer for 2010 amounted to only 0.56% of total world beer imports, way below the United States (37%), France (6.8%) and the UK (6.6%). China’s exports for the same year amounted to only 1.4% of total world beer exports, below Mexico (21%), the Netherlands(19%), Germany (13%), and the United States (3.4%) to name a few. However, because of the size of China’s economy, there is a huge potential for the world’s largest beer exporters to see China with a lot of optimism. Read more…


The Role of Social Media in Politics

The role of social media in the political arena has increased considerably as of lately. During the Democratic National Convention, last week, it was clear that social media was an important channel for disseminating information as events were taking place. According to the online site TechCrunch, first lady Michelle Obama’s speech had generated 28 thousand tweets per minute.

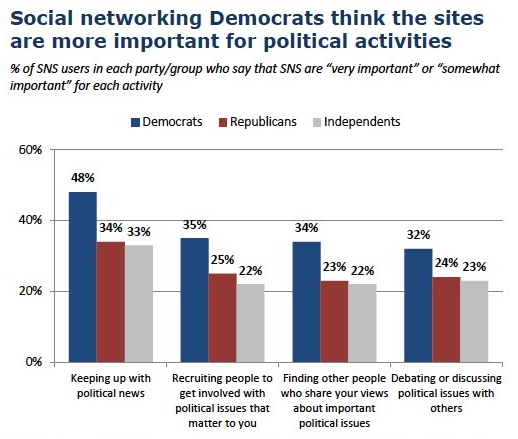
A report published by the Pew Research Center, based on a survey on social network site users, states that Democrats are more likely to consider the use of social media important or very important in keeping up with political news, recruiting people for their cause, discussing political issues with other people and finding other people who share their political views, compared to their Republican or Independent counterparts.

The Catholic States of America

Religion in the US - Catholic Rates of Adherence County Map

Membership in the Catholic church in the US has increased in recent years primarily due to immigration from Latin America. States with large Irish- and Italian-American populations also have significant numbers of Catholics. The map above shows membership per 1000 people for all counties in the US. New Mexico, California and Texas have the highest rates of adherents.

Note: The data were downloaded from the Association of Religion Data Archives, www.TheARDA.com

The Evangelical States of America

Religion in the US - Evangelical Protestant Rates of Adherence County Map

Continuing our series of maps about religion in the US, today we take a look at membership in Evangelical Protestant churches. The map above shows the rate of adherence per 1,000 people for all counties in the US (click on the map for the full-size version). Darker colors represent a higher rate of adherence. We split the data into five equal ranges: <200, 200-400, 400-600, 600-800, and > 800. The highest adherence rates can be found in the southern states, which are the traditional stronghold of the Evangelical movement.

Note: The data were downloaded from the Association of Religion Data Archives, www.TheARDA.com

Freedom of the Press Around the World in 2012

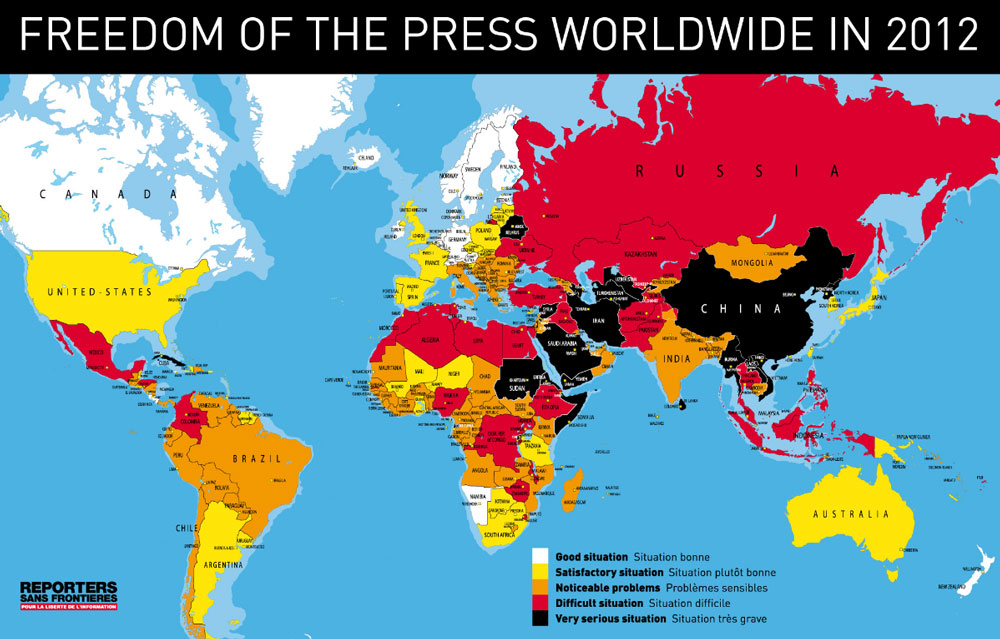
2012 has seen positive and negative changes in freedom of the press around the world. Reporters Without Borders, the largest organization that advocates freedom of the press worldwide, compiles a Press Freedom Index where countries ranking at the top score high in press freedom, and countries at the bottom constitute the most repressive in terms of freedom of information and violence against journalists.

Some countries ranking at the top include Finland, Norway and Estonia. Countries at the bottom include Eritrea, North Korea and Turkmenistan. Countries showing improvements worth noting include Tunisia, South Sudan and Niger. In Latin America, Brazil showed the biggest decline.

Church Membership in the US

Religion in the US - Rates of Adherence County Map

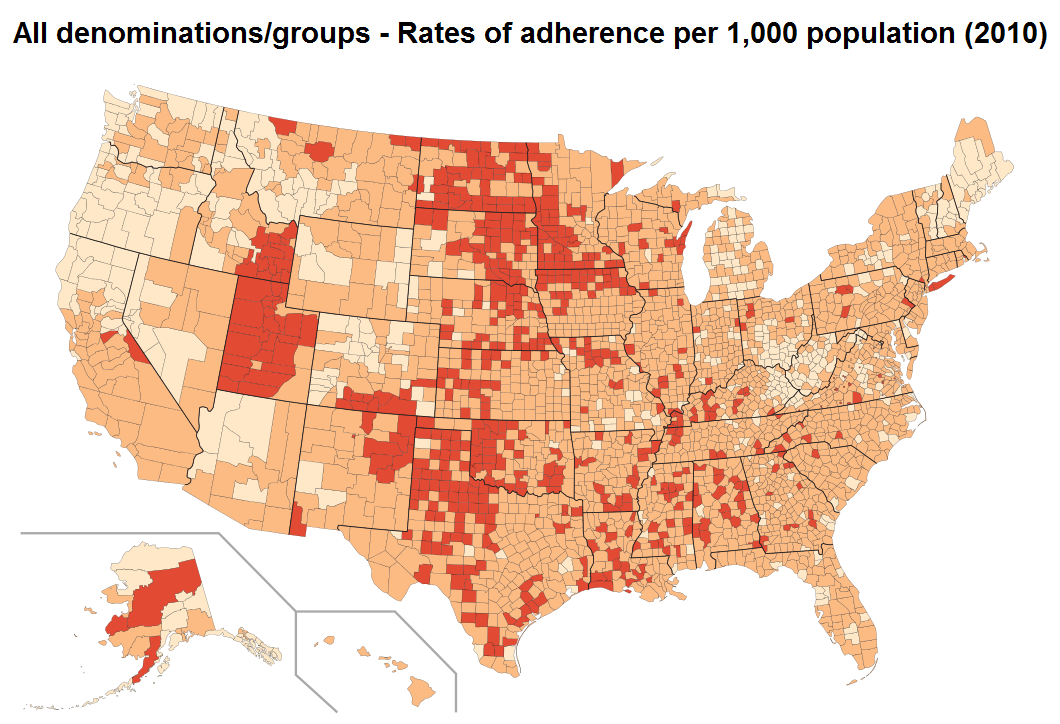
We recently came across a study about church membership in the US conducted by the Association of Statisticians of American Religious Bodies (ASARB). The study compiled data on the number of congregations and adherents for 236 religious groups in each county of the US. We were curious about what the data would look like displayed on a map, so we created the thematic map shown above (click on it for the larger version). We chose three colors to represent the rate of adherence: the lighter color is for counties where the rate of adherence is less than 333 per 1000 inhabitants. The medium color is for counties with a rate of adherence between 333 and 667, and the darkest color is for counties with rate of adherence greater than 667 per 1000.

Note: The data were downloaded from the Association of Religion Data Archives, www.TheARDA.com

Political Rights and Civil Liberties Around the World for 2012

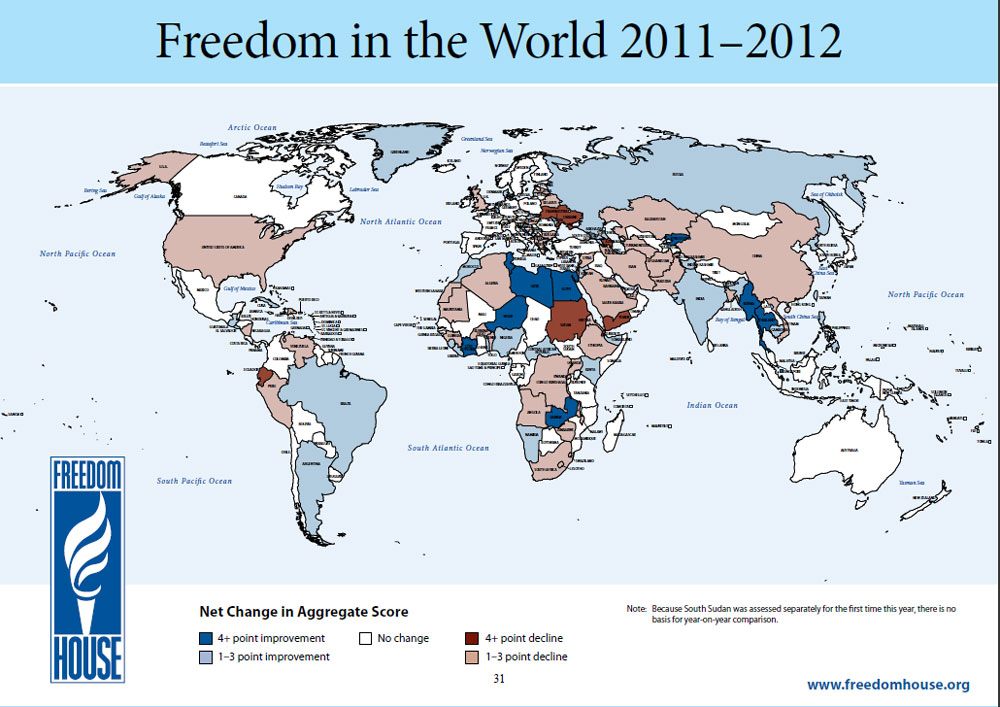
2011 and 2012 have been years full of changes in the level of political rights and civil liberties around the world, primarily due to the Arab uprisings. Freedom House, an organization that supports democratic change, monitors freedom, and advocates for democracy and human rights around the world, has identified which countries have improved and which countries have declined in their level of freedom. The Freedom House Index (FHI) designates countries and territories included in the index as “free”, “partly free”, and “not free”.

As shown in the map above, Egypt, Libya, Tunisia and Burma are among the countries that have improved the most, while Ecuador, Sudan and Yemen are among the worst performers.

West Nile Virus Cases by County

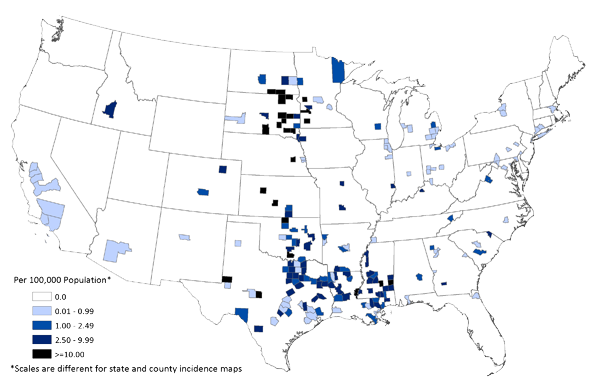
West Nile Virus cases in the US as of August 21, 2012

The current outbreak of West Nile virus in the US is the most serious since the disease was first detected in the country in 1999. Thus far, 1118 cases have been reported to the Centers for Disease Control and Prevention (CDC), including 41 deaths. Find out if any cases have been detected in your county by clicking on the map above.