Category Archives: Peru

Things Each Country Leads the World In

what each country leads the world in

Each country leads the world in different things, from good to bad things to awkward ones.

According to the map above, France leads the world in tourism, India in making movies, Saudi Arabia in oil reserves, the United States in producing Nobel laureates, Greece in olive oil consumption, Switzerland in the rate of employment, Norway in democracy, Brazil in FIFA world cup titles, and Costa Rica in happiness, to name a few.

Other countries lead in not so positive things. For example, Russia leads in the number of nuclear warheads, China in carbon emissions, Afghanistan in opium production, North Korea in censorship, and Yemen in gender inequality.

Among the awkward we find Venezuela leading in the number of miss universe titles, Argentina in exporting soccer players, Netherlands in the tallest people, Iran in the highest brain drain, Sweden in atheism, and Mexico in lightning strikes.

Source: Policy Mic: This Map Shows the Weird Things Each Country Leads the World In


Most Visited Website per Country

most visited website per country

Google, Facebook, and Chinese search engine Baidu are the top three most visited websites in the world.

Using freely available website traffic statistics from Alexa, the authors of the map above found that most people in North America, Europe, South East Asia, and Oceania prefer Google. Due to the large number of Internet users in China and South Korea combined, an estimated one billion users, Baidu is the most visited website behind Google. Facebook comes in third with an estimated 280 million users spread from Latin America to the Middle East.

Source: Information Geographies: Age of Internet Empires


The Failed States Index 2013

failed state index 2013Fund For Peace just released the Failed State Index (FSI) 2013. The FSI measures the level of risk in each country using a series of risk indicators such as mounting demographic pressures, massive movement of refugees, uneven economic development, poverty, legitimacy of the state, progressive deterioration of human services, violation of human rights, violation of the rule of law, security apparatus, intervention of external actors, etc. The FSI is calculated for a total of 178 countries.

Nations ranking at the top for failed states (red) include Somalia, Congo, Sudan, and South Sudan. Unfortunately, most of the world’s nations seem to be under a warning (orange) for failed states, from Africa to Asia to Latin America.

For the complete list of countries, rankings and scores, please visit: Fund For Peace: Failed State Index (FSI) 2013


Violence Against Women by World Region

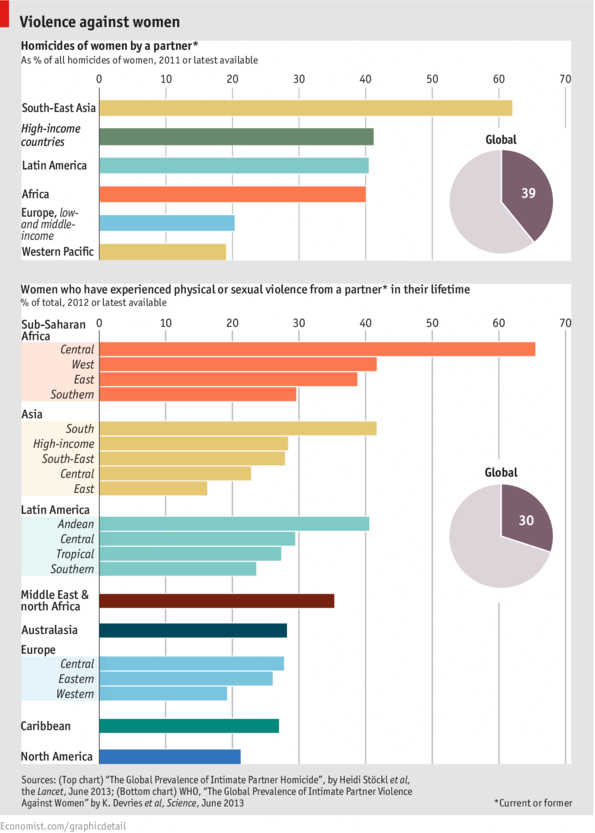
violence against womenIn this chart published by The Economist we look at two sets of data about violence against women.

The first one shows that more than a third (39%) of homicides of women around the world are committed by a previous or current partner. The numbers are specially shocking for South East Asia (Cambodia, Laos, Myanmar [Burma], Thailand, Vietnam, Brunei, Malaysia, East Timor, Indonesia, Philippines, and Singapore). The numbers are also high for Latin American and African countries.

The second set of data shows that 30% of women around the world have experienced physical or sexual violence during their lifetime by a former or current partner. The numbers are the highest for Central African countries (Burundi, Central African Republic, Democratic Republic of the Congo, and Rwanda),  followed by countries in West Africa (Benin, Burkina Faso, Ivory Coast, Ghana, Liberia, Nigeria, Senegal, Sierra Leone, etc.), South Asia (Afghanistan, Bangladesh, Bhutan, India, Maldives, Nepal, Pakistan, and Sri Lanka), the Andean region of South America (Colombia, Venezuela, Ecuador, Peru, and Bolivia), the Middle East, and North Africa.


Extradition Treaties of the U.S. with Other Countries

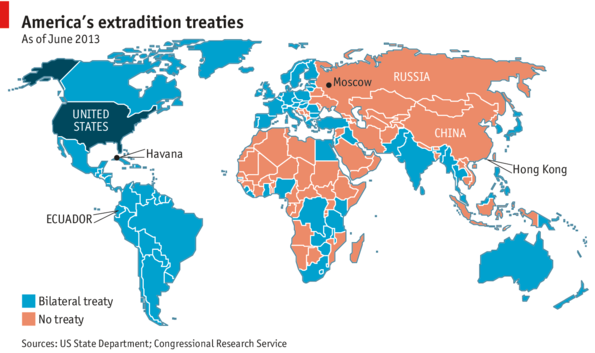
american extradition treatiesAn estimated 100 countries have signed bilateral extradition treaties with the United States, including all Latin American countries, Western European countries, Egypt, India, Australia, and New Zealand to name a few. Some 60 nations including China, Russia, several Middle Eastern and African countries have not. However, even if some countries signed extradition treaties they can still refuse to hand an individual over to the U.S. if that person is seeking asylum or if he/she would face the death penalty.

Source: The Economist: Daily Chart: Where can he go?


Key Commodities and Emerging Markets

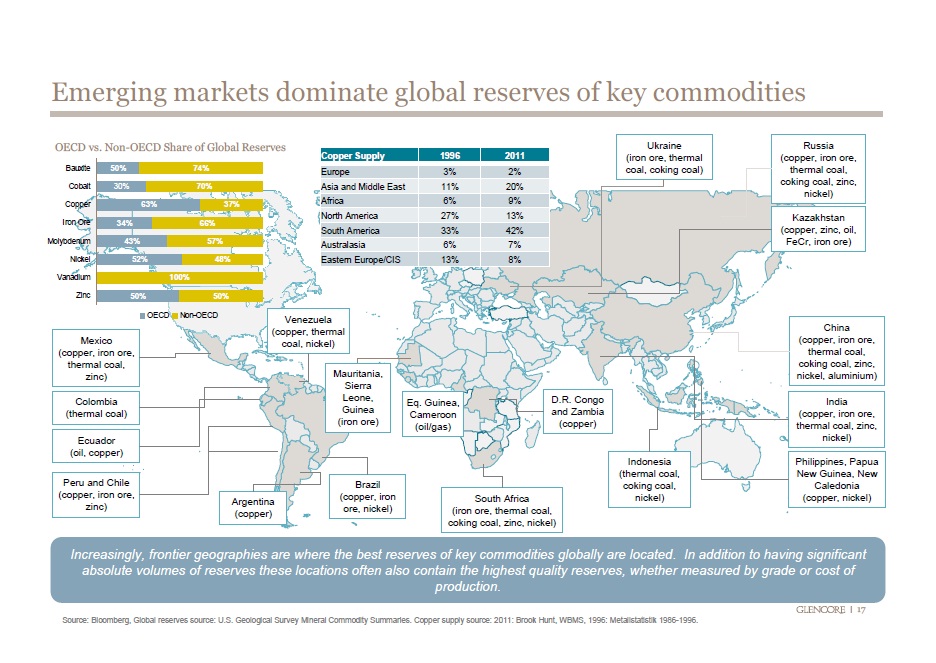
emerging market dominate commoditiesCommodities are raw materials essential for the production of more complex products. Commodities fall into three large categories: agricultural, energy, and metals.

According to this visualization, emerging economies (Brazil, Russia, India Indonesia, China, South Africa, etc.) have the largest reserves of certain key energy and metal commodities such as oil, coal, copper, cobalt, iron ore, molybdenum, nickel, zinc, and aluminum.

Source: Business Insider: 36 Maps That Explain The Entire World


Percentage of the Population Living on $2 or Less a Day

surviving on a few dollars per day worldMIT economists Abhijit V. Banerjee and Esther Duflo, conducted surveys in developing nations to see which countries survive on a few dollars per day. The cities or countries where people are known to live on meager dollar amounts on a daily bases are not that surprising, but the percentage of the population living under these conditions is.

In Udaipur and Hyderabad (India) a staggering 94% of the population survive on $2 or less per day. In Bangladesh, 69.4% go on $2 or less per day. In Ghana, 67.7% survive on $2 or less per day. In Guatemala, 64.8% of the population survive on $2 or less per day.

Source: GOOD: Living on Less


Drought Severity by Country (1901 – 2008)

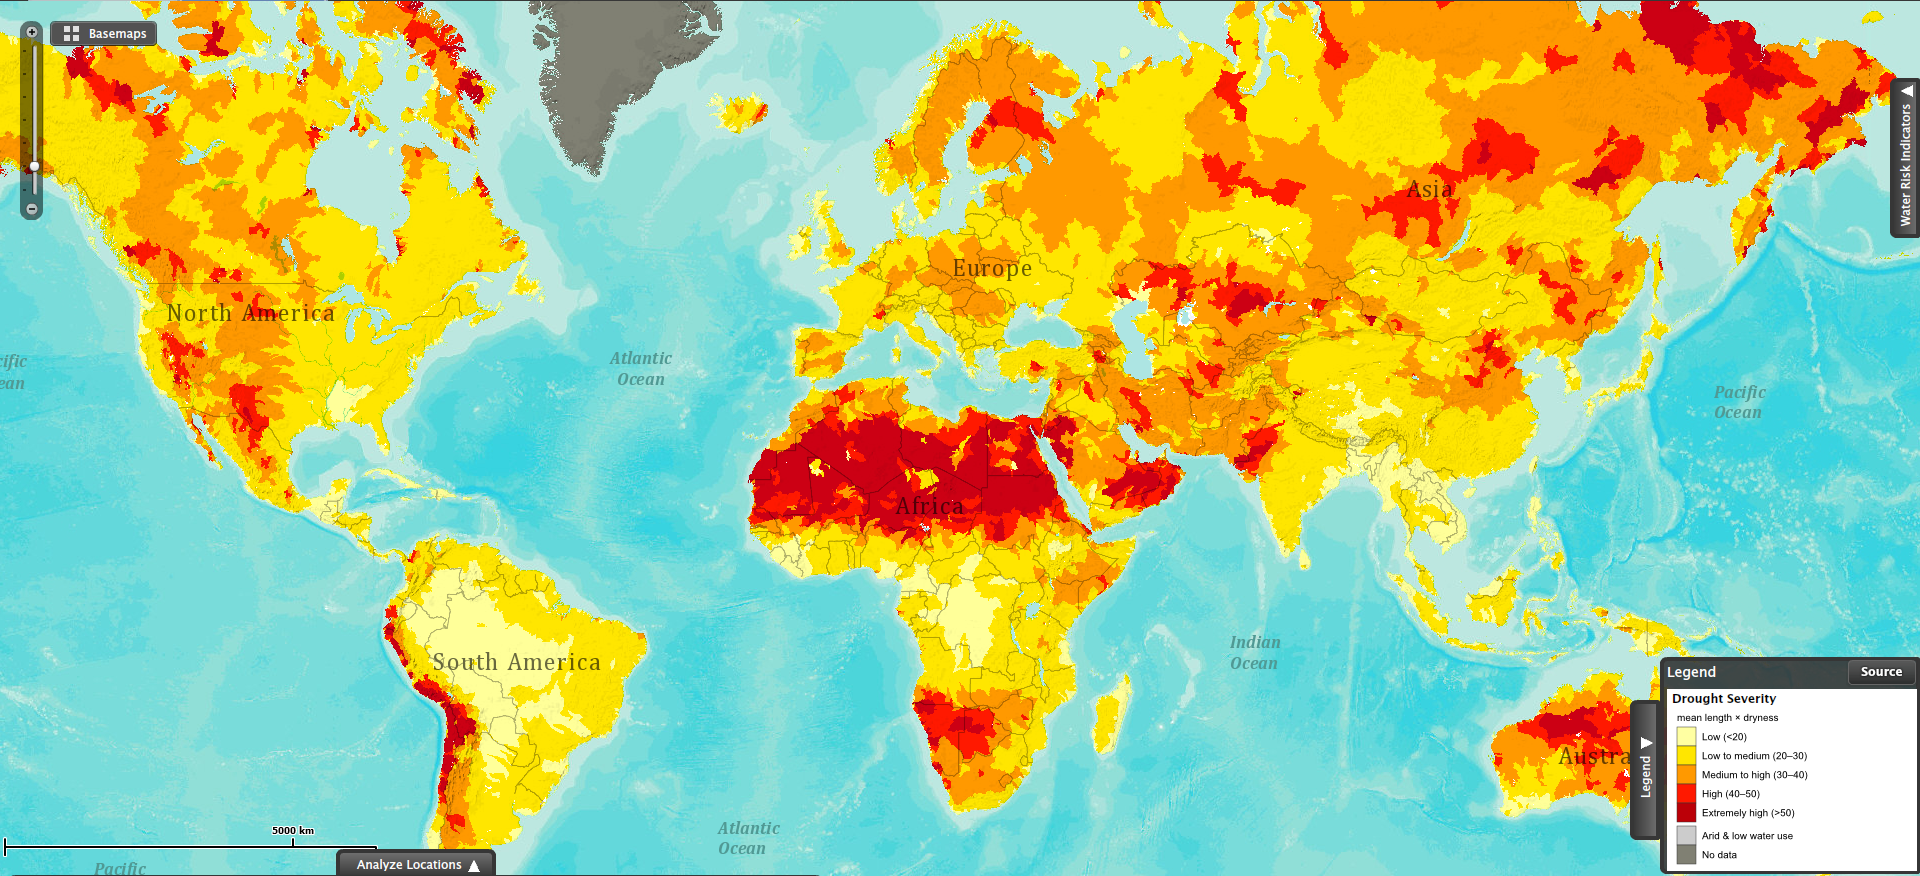
drought severity worldThis map shows drought severity, measured as the product of the average length of a drought occurrence and how dry it was the drought. This visualization is based on data collected for the period between 1901 and 2008.

The red areas in the map show the regions most severely affected by droughts. The northern region of the African continent stands out as the largest area being affected by severe droughts. Southwestern Africa (Namibia and Botswana) has also been severely affected by droughts in the same period.

Some areas in the Andean region in South America (Ecuador, Peru, Bolivia, Chile and Argentina) have also suffered the effects of severe droughts during the past century.

Parts of Australia and Russia have also been affected by extreme drought conditions.

Sources:


Body Mass Index (BMI) by Country

A body mass index (BMI) between 18.5 and 24.9 is usually considered a healthy body weight to height relationship. A BMI of 25 or higher indicates body weight not optimal for the height of a particular person.

This visualization published by Visual.ly, shows the different BMI values for adult men and women across the globe.

Countries with a healthy average BMI between 20 and 22.9 include several nations in Africa, Yemen, India, Thailand, Japan, Pakistan, Singapore, among others.

Countries with an average BMI between 23 and 24.9 include several Asian nations, several European nations (including France), some nations in Africa, and Honduras.

Countries with an average BMI between 25 and 26.9 include Canada, Russia, Costa Rica, Colombia, Israel, Austria, Switzerland, Brazil, all Nordic countries, Spain, Portugal, and nations in the Middle East.

Countries with an average BMI of 27 and over  (the highest BMI range) include the United States, Kuwait, Cuba, Argentina, Chile, Bolivia, Peru, Venezuela, Australia, UK, New Zealand, Greece, and Germany to name a few.


Tipo de Cambio Nuevo Sol Peruano Dólar

El tipo de cambio del nuevo sol peruano con respecto al dólar americano se mantuvo relativamente constante, con un valor entre 3.6 y 3.0 para el periodo 2000-2007.

Entre diciembre 2007 y septiembre 2008 el tipo de cambio cayó por debajo de 3.0 nuevos soles por 1 USD. A partir de octubre 2008 el tipo de cambio empezó a depreciarse nuevamente pasando por encima de los 3.0 nuevos soles por dólar. Desde mayo del 2009 el nuevo sol empezó a apreciarse otra vez.

Tipo de Cambio Nuevo Sol Peruano Dolar

Fuente: Banco Central de Reserva del Perú

Ver también: Series históricas para otras monedas