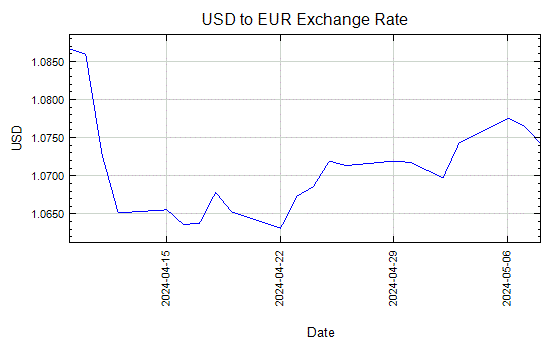
Starting today anyone may embed our exchange rate charts in their blog or web site. Just copy and paste the HTML displayed under each graph. Here is an example:

The code used to embed the chart above is as follows:
Obtaining a different graph is as simple as changing the values of four query string parameters:
c1: currency code for the base currency, e.g. USD for the US Dollar
c2: currency code for the target currency, e.g. EUR for the Euro
days: time span displayed in the graph, e.g. 30 for 30 days
lastday: last date displayed in the graph, e.g. 20080228 for February 20, 2008
The combination of days and lastday allows you to control the first and last dates displayed in the chart. For example, if you need to graph the Dollar to Euro exchange rate for the last 90 days of 2007, you would set days=90&lastdate=20071231
Leave me a comment if you need further details on how to embed the charts.