Category Archives: Indices

The Happy Planet Index 2012

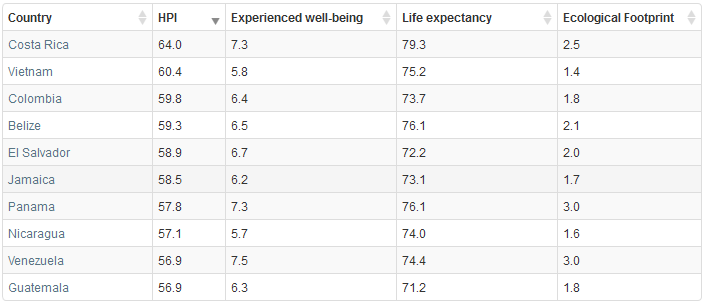
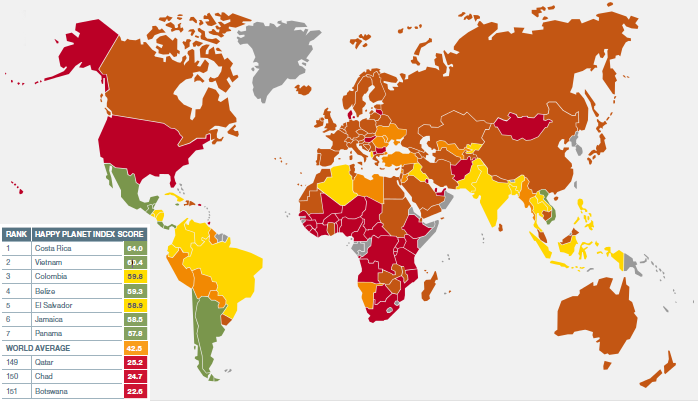
The Happy Planet Index (HPI) measures how countries provide their citizens with a long and happy existence within their borders.

The HPI measures three variables: experienced well-being, life expectancy and environmental footprint. Environmental footprint is a measure of resource consumption. Scores for each variable are combined to create an overall measurement, where the color green represents the best performance for all three variables. The HPI has been calculated for 151 countries.

The highest ranking countries on the HPI are: Costa Rica, Vietnam, Belize, Colombia and El Salvador. See table below:
For more information about the HPI methodology, definitions and the complete list of ranked countries, please visit: The Happy Planet Index
 

The Best and Worst Places to be Born in 2013

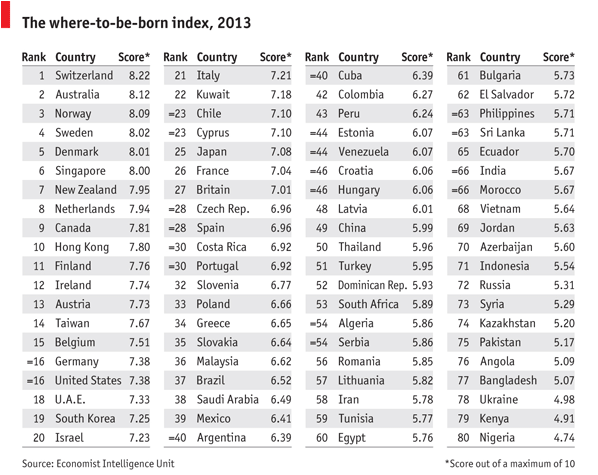
Back in 1988, the United States was ranked first as the best country to be born. Twenty five years later, the U.S. is ranked number 16.

The Economist Intelligence Unit compiled the where-to-be-born index which measures which country will provide the best opportunities to someone born in 2013. It links the results of life satisfaction surveys to indicators that affect the quality of life in those countries, such as geography, demographics, culture, government policies, the economy, etc.

Based on those factors, the best places to be born are Switzerland, Australia followed by Norway, Sweden Denmark, and Singapore. At the bottom of the list you will find Nigeria, Kenya, Ukraine, Bangladesh, Angola, Pakistan, among others.


Vulnerability to Climate Change

The Global Adaptation Institute (GAIN) created the GAIN Index to measure the vulnerability of countries to climate change, combined with how well prepared these countries are to face the global challenges associated with it.

Countries at extreme risk include North Korea, the Democratic Republic of Congo, Iraq, Burundi, Chad, Sudan and Zimbabwe. At the other end of the spectrum, countries with the lowest risk include Denmark, Australia, Switzerland, Norway, the UK, New Zealand, Norway, to name a few.

For a complete list of countries and index methodology visit: The Global Adaptation Institute: The GAIN Index


The Most and Least Peaceful Countries

click to enlarge

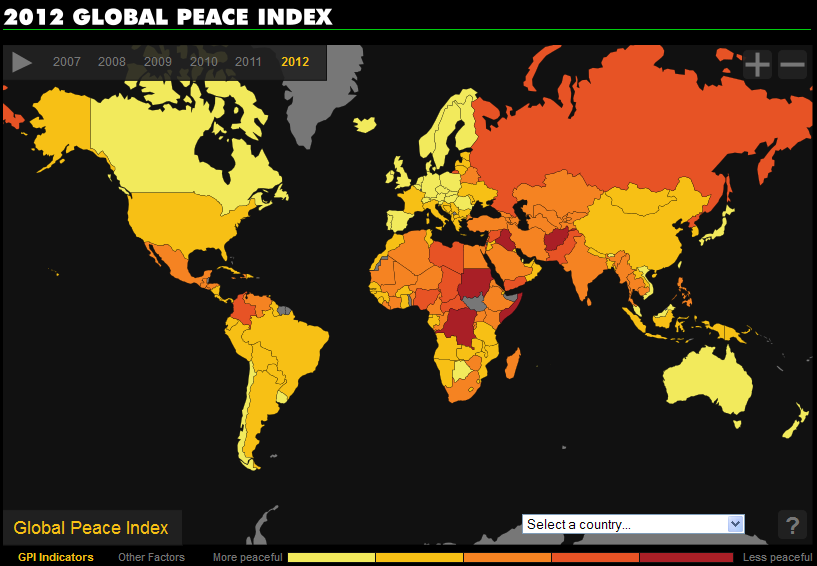
Vision for Humanity has compiled the Global Peace Index (GPI) for 2012. The GPI is a composite index that measures the peacefulness of countries around the world. It considers 23 weighted quantitative and qualitative indicators such as perceived criminality in society, access to weapons, imports of weapons, military expenditure, homicides, political instability, jailed population, weapons exports, violent crime, among others.

The lower the score, the more peaceful the nation. I that context, the most peaceful country is Iceland, followed by Denmark, New Zealand, Canada and Japan. On the other end of the spectrum, the least peaceful country is Somalia, followed by Afghanistan, Sudan, Iraq and the Democratic Republic of Congo.

The interactive map can be found at: Vision of Humanity: 2012 Global Peace Index

For detailed information about the GPI and its methodology, visit: Institute for Economics and Peace: Global Peace Index 2012


The Most Corrupt Countries in the World

click to enlarge

The Corruption Perceptions Index (CPI) just released for 2012 by Transparency International ranks 176 nations according to the perceived corruption levels of their public institutions. The CPI uses a scale of 0-100, 0 being the most corrupt and 100 the least corrupt. For 2012 the most corrupt countries, ranking at the bottom with a score of 8, are Somalia, North Korea and Afghanistan. At the other end of the spectrum, ranking at the top with a score of 90 are Denmark, Finland and New Zealand.

The CPI is a composite index based on a combination of surveys and assessments of corruption compiled by different reputable institutions worldwide.

See complete report: Transparency International – 2012 Corruption Perceptions Index


Terrorism Around the World

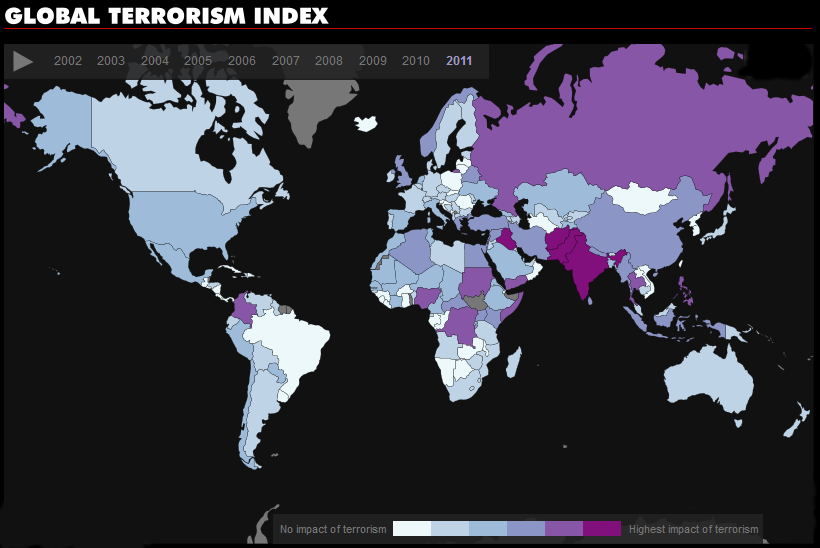
The Global Terrorism Index (GTI) ranks 158 countries based on the impact of terrorism in each of these countries. The rankings goes from 1 to 10, 1 being the lowest impact of terrorism and 10 the highest impact of terrorism. For 2011, the countries ranked at the top are Iraq, Pakistan, Afghanistan and India, followed by Yemen, Somalia, Nigeria, Thailand, Russia, the Philippines, Sudan, the Democratic Republic of Congo, Colombia and Syria.

The GTI uses four indicators to measure the impact of terrorism: number of incidents, number of deaths, injuries and property damage. A five year weighted average is also used in order to measure the lasting impact of terrorism in a particular country.

For more details see: Vision of Humanity – Global Terrorism Index


Housing Market: Home Prices are Up!

The latest numbers for the S&P/Case-Shiller House Price Index, just released, show an increase in home prices for twenty major cities in the United States. Both the 20-City Composite and 10-City Composite show similar trends, the first with a 1.6% increase and the second with a 1.5% increase for the month of July 2012. This numbers constitute a second year-over-year rise, following a decline in 2010 caused by the end of the Housing Stimulus package in April of that same year.


Freedom of the Press Around the World in 2012

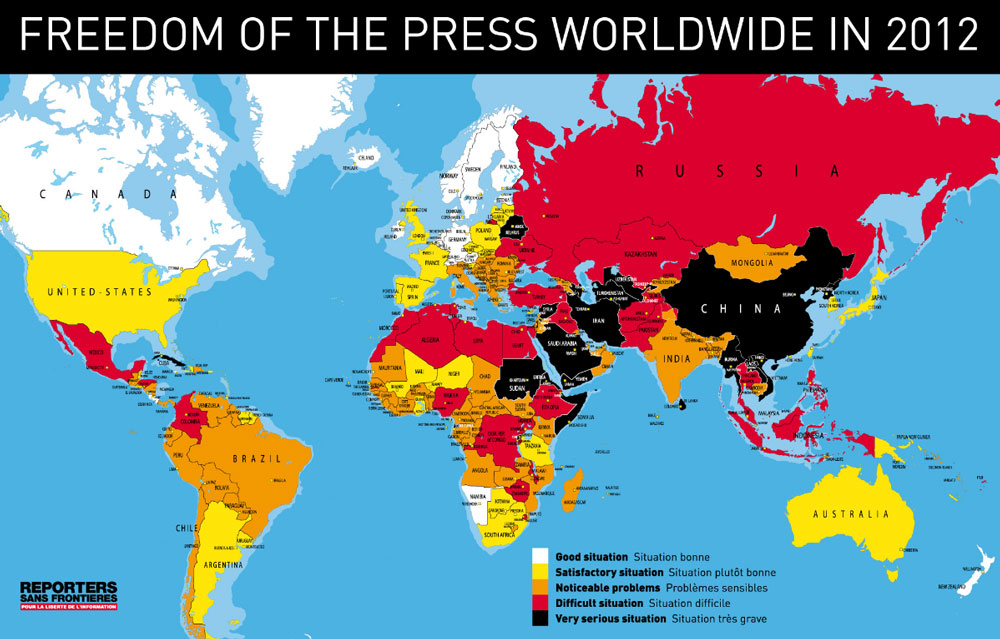
2012 has seen positive and negative changes in freedom of the press around the world. Reporters Without Borders, the largest organization that advocates freedom of the press worldwide, compiles a Press Freedom Index where countries ranking at the top score high in press freedom, and countries at the bottom constitute the most repressive in terms of freedom of information and violence against journalists.

Some countries ranking at the top include Finland, Norway and Estonia. Countries at the bottom include Eritrea, North Korea and Turkmenistan. Countries showing improvements worth noting include Tunisia, South Sudan and Niger. In Latin America, Brazil showed the biggest decline.

Political Rights and Civil Liberties Around the World for 2012

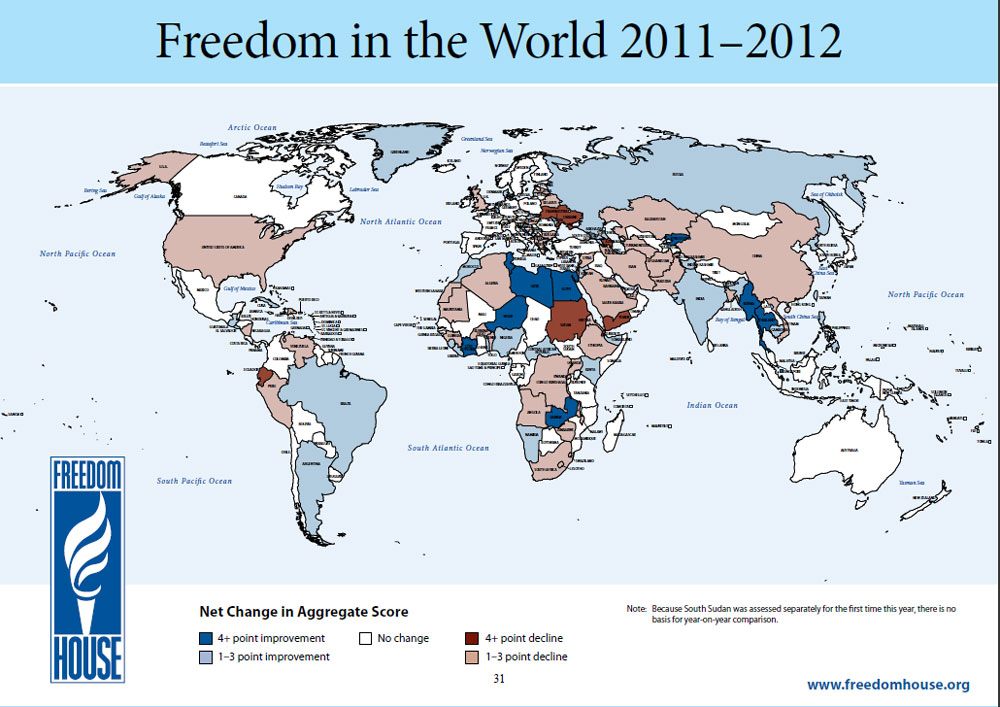
2011 and 2012 have been years full of changes in the level of political rights and civil liberties around the world, primarily due to the Arab uprisings. Freedom House, an organization that supports democratic change, monitors freedom, and advocates for democracy and human rights around the world, has identified which countries have improved and which countries have declined in their level of freedom. The Freedom House Index (FHI) designates countries and territories included in the index as “free”, “partly free”, and “not free”.

As shown in the map above, Egypt, Libya, Tunisia and Burma are among the countries that have improved the most, while Ecuador, Sudan and Yemen are among the worst performers.

Industrial Production, Producer Prices and Consumer Confidence

Industrial production is up for the month of July, with a 0.6% increase. So is the core Producer Price Index (excludes energy and food) with an increase of 0.4%. Consumer confidence varies from state to state, with optimistic states located around the District of Columbia area and the Midwest, and pessimistic states mostly in the southern part of the country. Read below:

  1. Three Numbers to Watch: US Industrial Production,CPI; UK Unemployment – Yusuf Yassin [TradingFloor.com]
  2. Industrial Production Climbs 0.6% in July – Steve Goldstein [Market Watch]
  3. Producer Prices Come In A Bit Higher Than Expected – Sam Ro [Business Insider]
  4. Consumer Confidence Varies from State to State – Interview with Frank Newport [Marketplace]
  5. U.S. Durable Goods Orders Drop in June – Agence France-Presse [IndustryWeek]