Category Archives: Links

Most of the World’s Population Live in Asia

more population mapAccording to this map published by the Washington Post, there are more people living within the lighted circle than there are outside of it.

The countries inside this circle are China, Mongolia, India, Indonesia, Bangladesh, Japan, South Korea, North Korea, Philippines, Vietnam, Thailand, Burma, Bhutan, Nepal, Malaysia, Taiwan, Sri Lanka, Cambodia, and Laos. The total population of those countries combined is an estimated 3.6 billion, about 51% of the total world population.


GDP Growth by Country for 2013

This chart by The Economist shows the latest forecast from the International Monetary Fund (IMF) for economic growth prospects worldwide.

Emerging economies such as China, Peru, Paraguay and several African nations, will enjoy GDP growth rates of 6% or higher. In contrast, several developed economies such as the United States, Canada, and several countries in Western and Southern Europe will experience GDP growth rates of 2% or lower, and in many cases even negative.


Industrial Water Consumption by Country

Across the globe, freshwater is consumed by four different economic sectors: domestic, industry, energy and agriculture. The agricultural sector is the largest consumer of water. The industrial and energy sectors follow suit, using 20% of available water resources.

This map (above), published by the Sustainable Sanitation and Water Management Toolbox, shows how much water is used by the industrial sector by each country. For the year 2009, the largest consumers of water for industrial use were the U.S. and Europe. Water consumption by the industrial sector accounted for 50% of total water use.


Industrial Production, Producer Prices and Consumer Confidence

Industrial production is up for the month of July, with a 0.6% increase. So is the core Producer Price Index (excludes energy and food) with an increase of 0.4%. Consumer confidence varies from state to state, with optimistic states located around the District of Columbia area and the Midwest, and pessimistic states mostly in the southern part of the country. Read below:

  1. Three Numbers to Watch: US Industrial Production,CPI; UK Unemployment – Yusuf Yassin [TradingFloor.com]
  2. Industrial Production Climbs 0.6% in July – Steve Goldstein [Market Watch]
  3. Producer Prices Come In A Bit Higher Than Expected – Sam Ro [Business Insider]
  4. Consumer Confidence Varies from State to State – Interview with Frank Newport [Marketplace]
  5. U.S. Durable Goods Orders Drop in June – Agence France-Presse [IndustryWeek]

Obesity in America: An Upward Trend

Obesity Trends Among US Adults 1991-2010
(BMI ≥ 30 lbs, or 30 lbs overweight for 5’4″ women)

Obesity has increased dramatically in the last twenty years. Mississippi has the highest percentage of obese adults, 34.9 %, followed by other twelve states with percentages higher than 30%. Most of these states are located in the Midwest and South. Is your state among the “fattest” states? Read more:

  1. STUDY: Mississippi Is The Fattest State – Ian Simpson, Reuters [Business Insider]
  2. Obesity Related Statistics in America [Get America Fit Foundation]
  3. Obesity could affect 42% of Americans by 2030 – Nanci Hellmich [USA Today]
  4. Adult Obesity Facts [Centers for Disease Control and Prevention]
  5. Junk Food Laws May Be Answer to Kids’ Obesity, Study Says [Fox News Latino]
  6. Childhood Obesity Facts [Centers for Disease Control and Prevention]


World Supply of Biggest Crops Decline and Food Prices Rise

The worst drought in fifty years has caused a decline in the stockpiles of crops such as corn, soybeans, rice and wheat, with the subsequent all-time increase in the prices of corn and soybeans. Good news for commodities investors.

The drought has also affected fuel and power production which, in turn, have a negative effect on food prices. Read more…

  1. Unfavourable weather behind the July rebound of the FAO Food Price Index – FAO Food Price Index [Food and Agricultural Organization of the United Nations]
  2. America’s disastrous corn harvest will hit world’s poor hardest [The Guardian]
  3. World food prices rising in response to drought damage in the US – Ole Hansen [TradingFloor.com]
  4. Global food reserves falling as drought wilts crops – Tony C. Dreibus and Elizabeth Campbell, Bloomberg [Futures Magazine]
  5. USDA slashes corn yield, production forecast – Bill Tomson [Market Watch]


Africa’s Resource Curse or Blessing

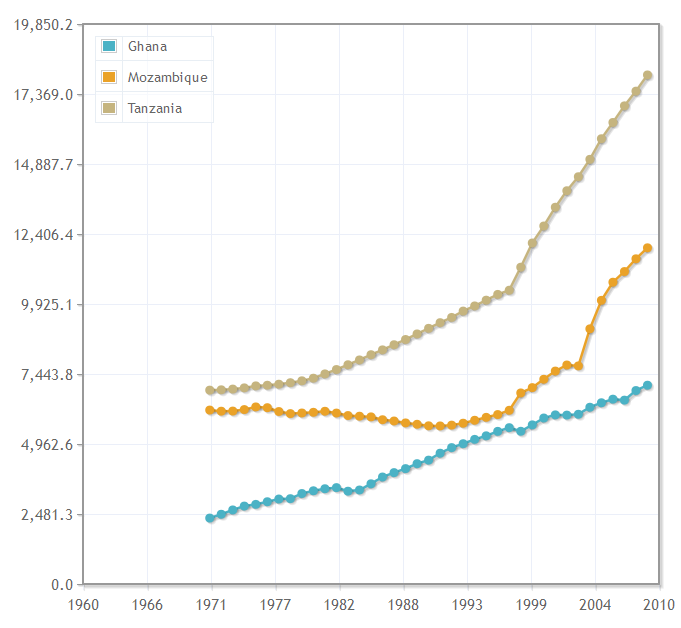
Energy Production for Select African Countries  (1960-2010)

The discovery of resources in developing countries has usually been more of a curse than a blessing for their economies, benefiting certain groups but not most of the population. Will this be the case for some African countries where resources have been recently discovered? Read more below:

  1. Energy Production of Select African Countries [IndexMundi]
  2. From Resource Curse to Blessing – Joseph Stiglitz [Project Syndicate]
  3. Beating the Resource Curse in Africa: A Global Effort – Terra Lawson-Remer and Joshua Greenstein [Council on Foreign Relations]
  4. Can New Oil States in Africa Avoid the ‘Resource Curse?’ Gabe Joselow [Voice of America News]
  5. Africa Must Tap Into Unused Resources – Kibaki – Wambui Ndonga [AllAfrica.com]
  6. Mining could spur Africa’s industrialization, but resource-curse risks persist – Terence Creamer [Engineering News]

Rare Earth Metals and Their Importance in Today’s Economy

  1. Rare-earth mining in China comes at a heavy cost for local villages [The Guardian]
  2. Rare earth metals: North Korea’s new trump card [The Korea Herald]
  3. EU Fights to Catch Chinese in Greenland Rare-earths Gold Rush – Agence France-Presse [Industry Weekly]
  4. World Trade Organization to Investigate China’s Limits on Rare-Earth Exports – Marketwire [SYS-CON Media]
  5. Rare Earth Elements – Dr. Ileana Johnson Paugh [Canada Free Press]

Poverty in the U.S. and Around the World

  1. The Poverty Line: One day, one person (The Poverty Line)
  2. World Population Below The Poverty Line – Map (IndexMundi)
  3. United States Poverty Rate by State 2006-2010 – Map (IndexMundi)
  4. United States – People of All Ages in Poverty: 2006-2010 by County – Map (IndexMundi)
  5. Global poverty, Absolute Poverty, Relative Poverty: A Fresh Look – Merrell J. Tuck-Primdahl (World Bank)