Category Archives: Maps

Minutes of Minimum-Wage Work to Buy a Big Mac Burger

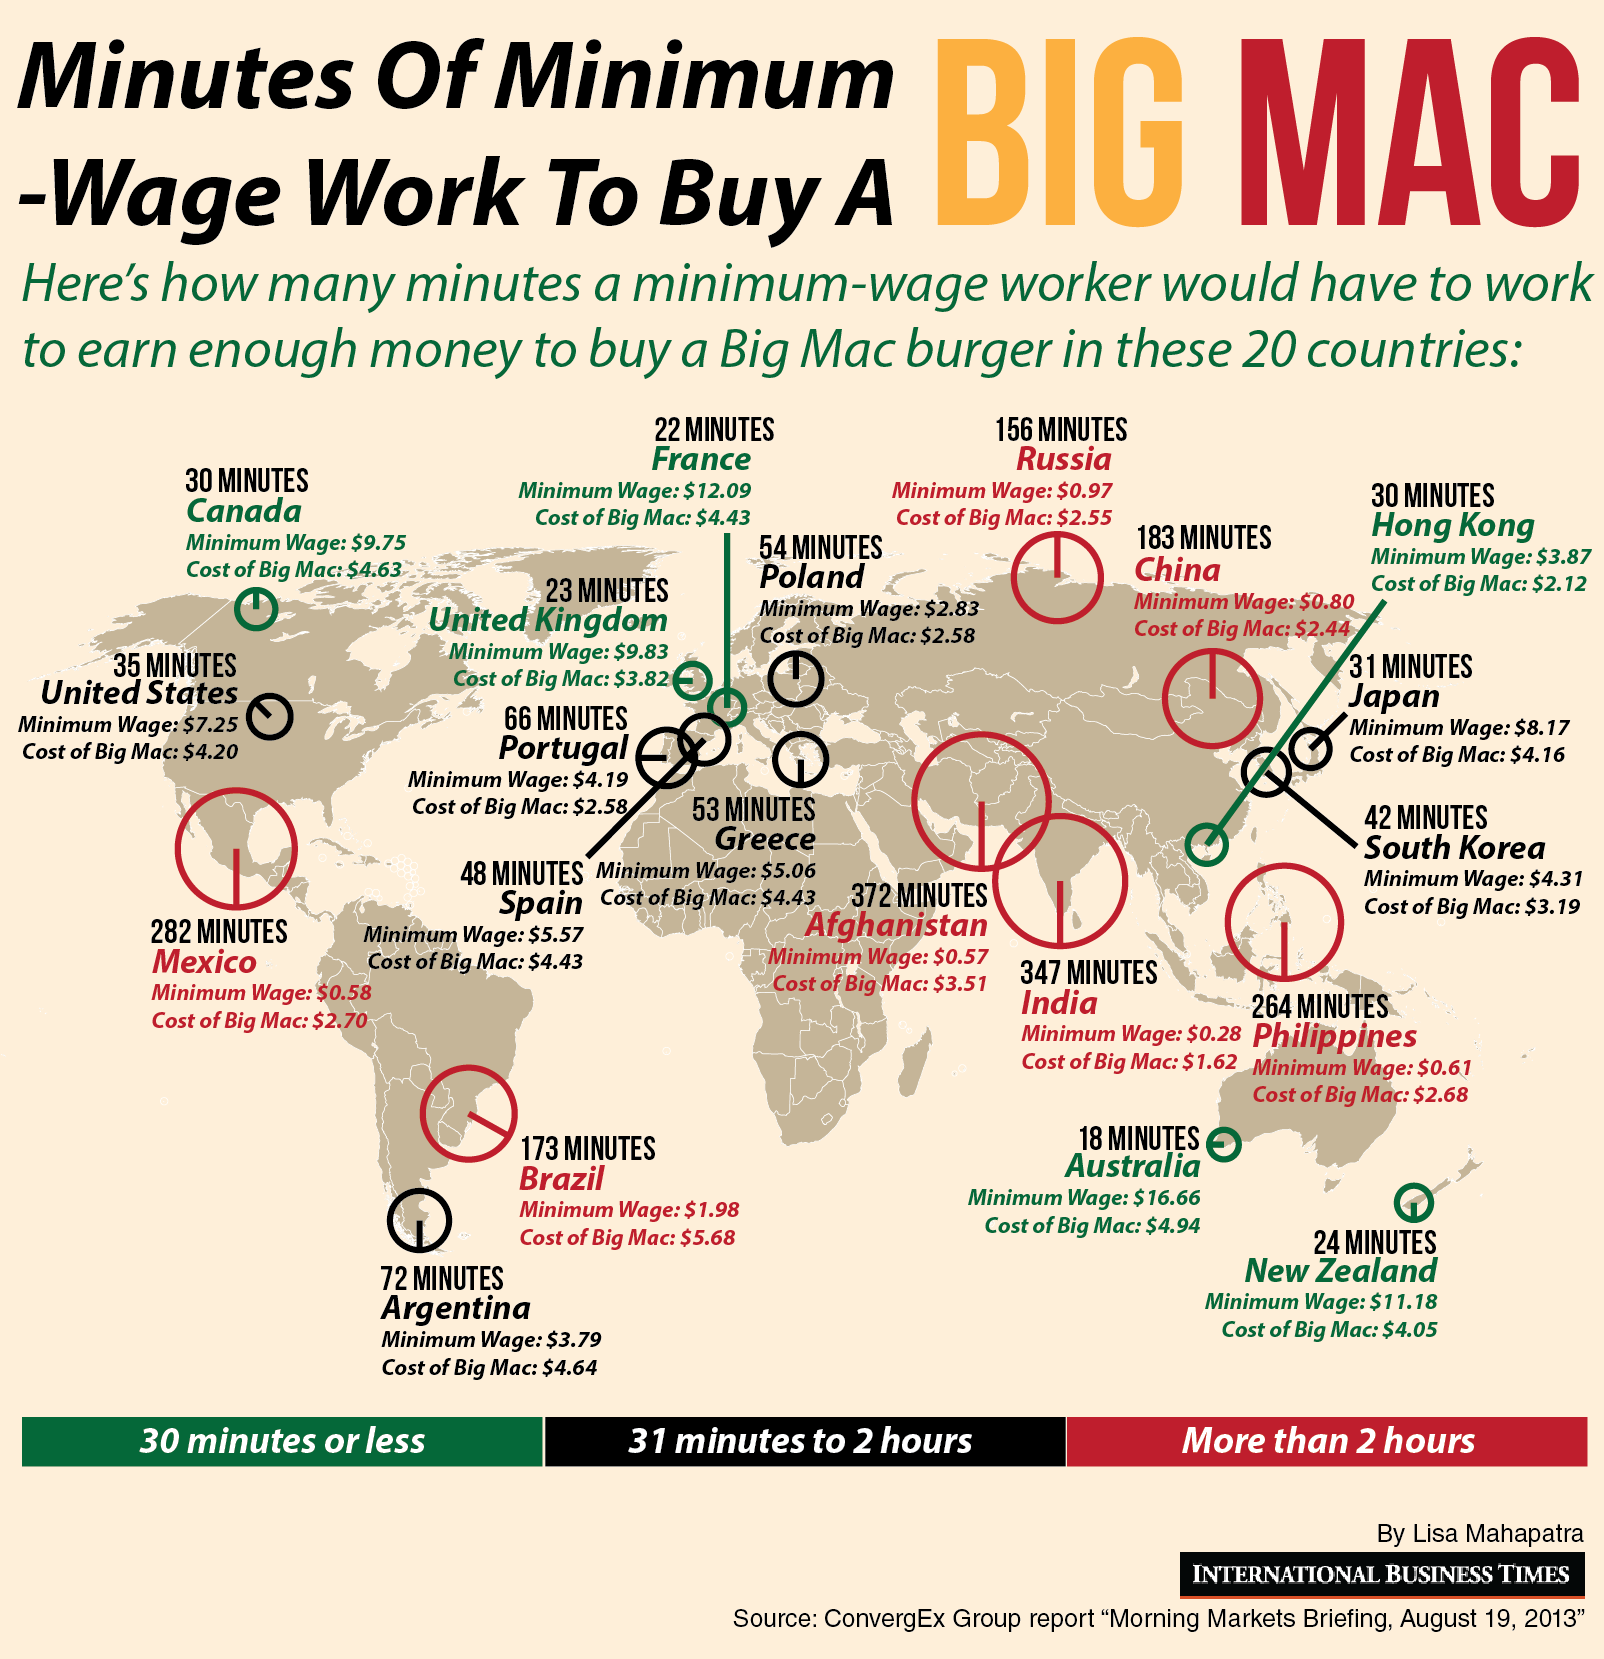
minutes of work for a big macUsing the criteria of the Big Mac Index developed by The Economist in 1986 as a way to measure if currencies are valued at the right level, the International Business Times created this visualization showing how many minutes a minimum-wage worker needs to work in order to buy a Big Mac burger.

As it turns out, a minimum-wage worker in Afghanistan needs to work 372 minutes (6.2 hours) in order to buy a Big Mac burger. In contrast, a minimum-wage worker in Australia needs to work only 18 minutes to buy a Big Mac burger.

Source: International Business Times: Minutes Of Minimum-Wage Work To Buy A Big Mac: 36 minutes in the US, 6 hours in Afghanistan


The Most and Least Ethnically Diverse Countries

diversity map harvardUsing data from the Harvard Institute for Economic Research, The Washington Post created this map that shows how ethnically diverse is a country.

Dark green countries are the more ethnically diverse. Such is the case of Canada, Mexico, several South American countries, including Peru, Bolivia, and Ecuador. The most ethnically diverse countries are located in Africa. In contrast, dark orange countries are more ethnically homogenous. That is the case of most European nations, China, Japan, South and North Korea, and Australia.


Writing Systems of the World

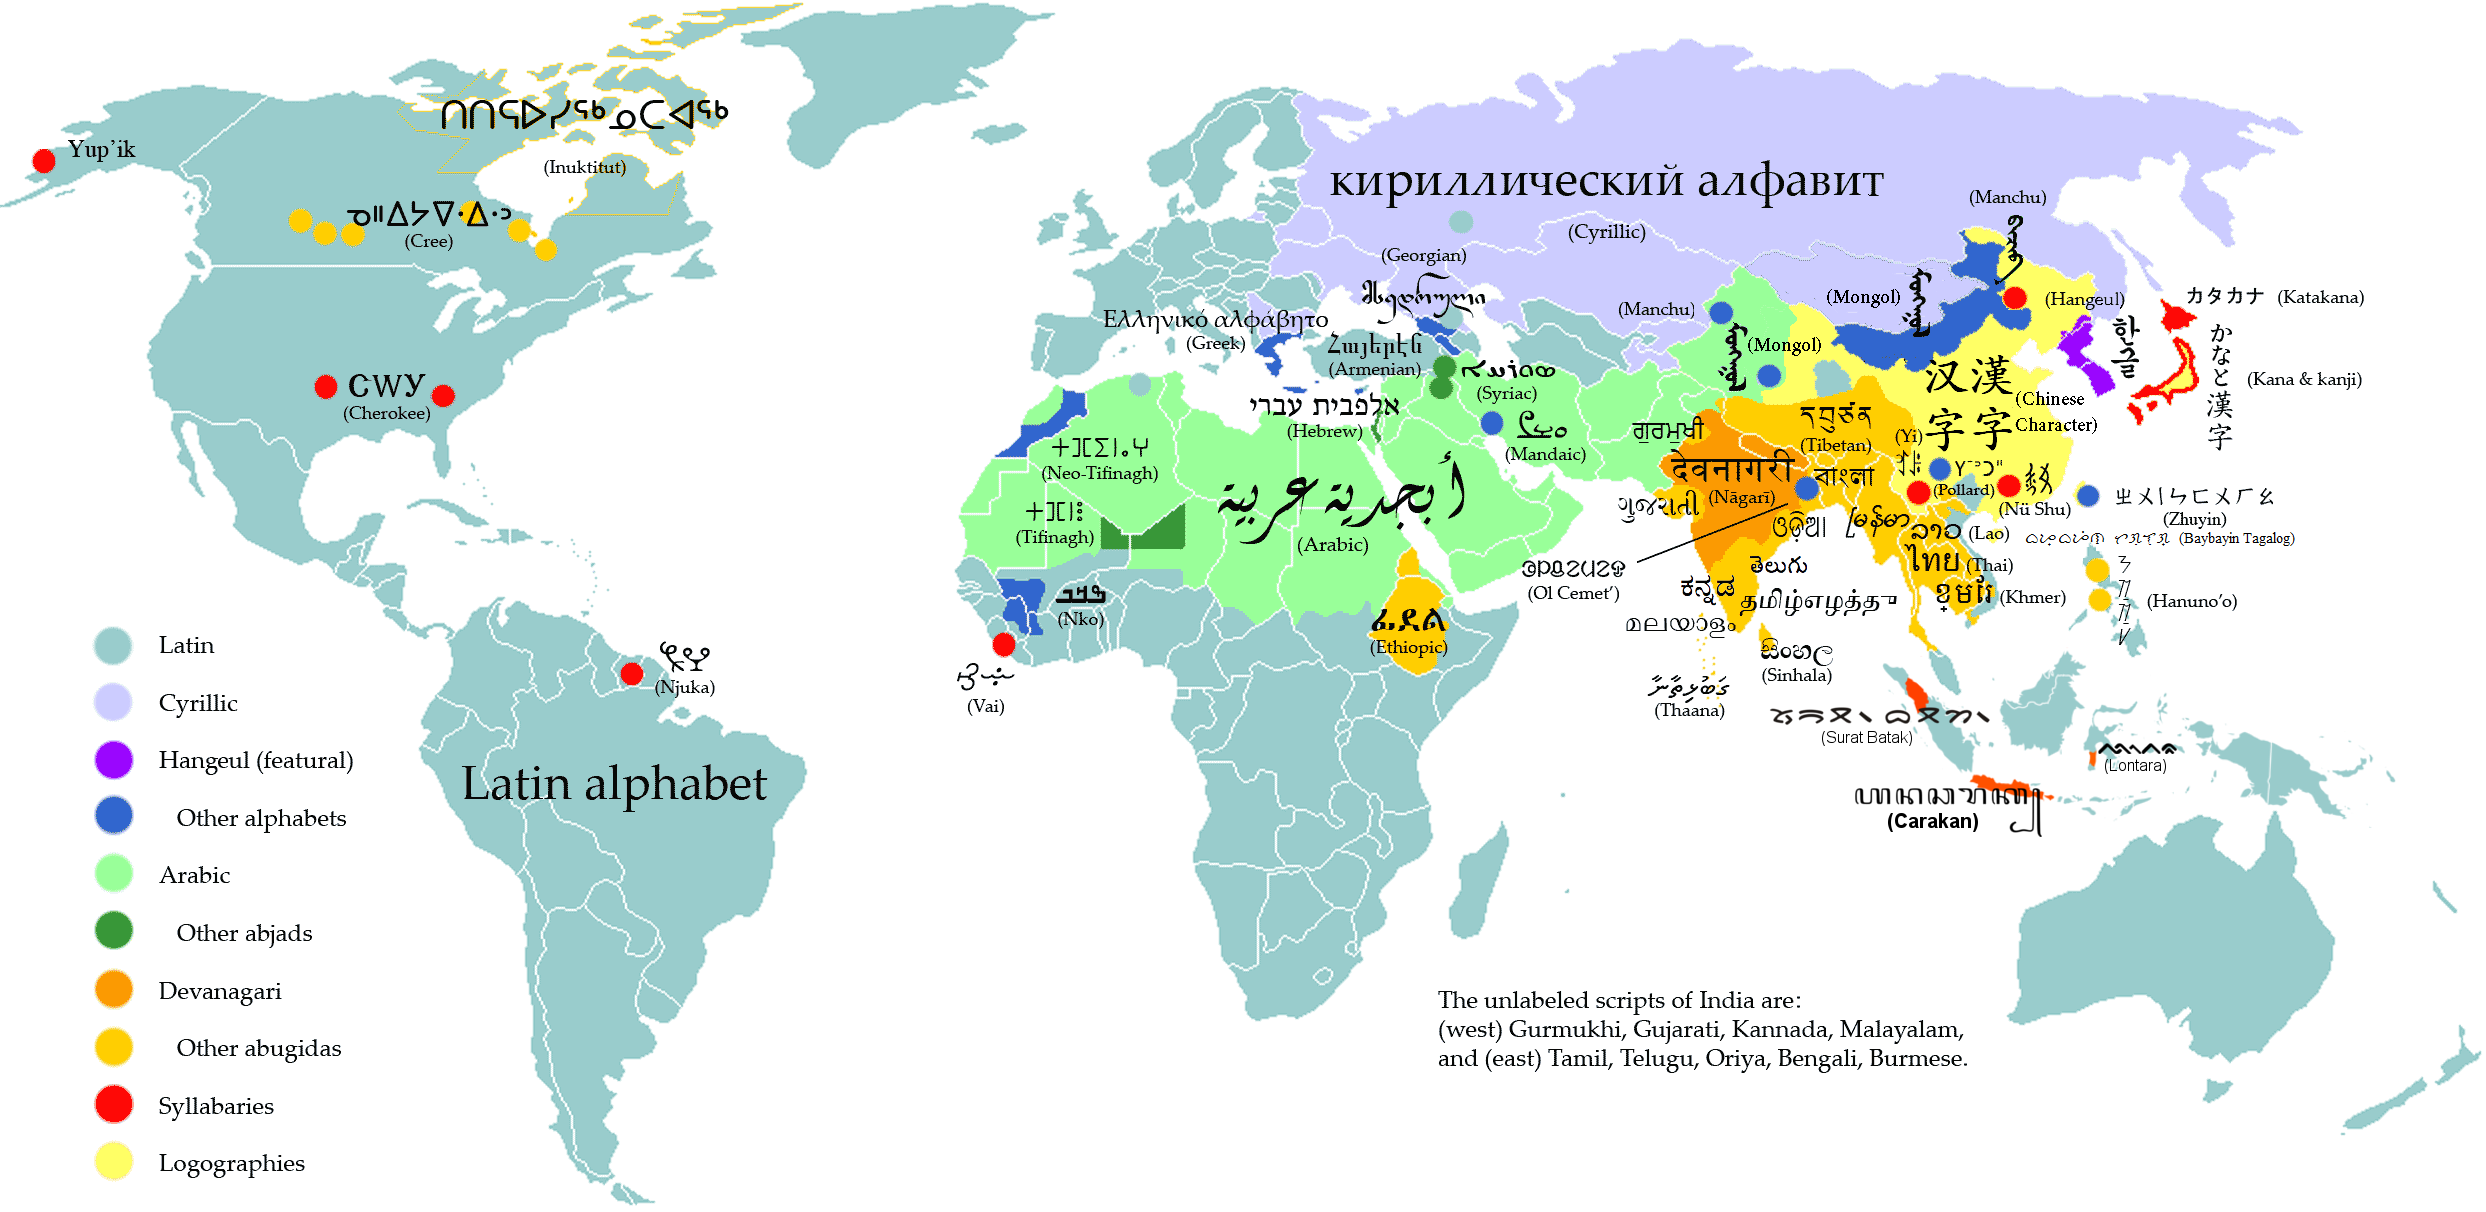
writing systems of the worldThis map published by the Washington Post shows the different writing systems used around the world.

The Latin alphabet is by far the most common used alphabet, from Europe to the Americas to Africa and Australia. The two other writing systems widely used are Arabic, used in the Middle East and Northern Africa, and Cyrillic used in Russia and other countries formerly part of the Soviet Union.


The United States Leads in Mobile Monetization

us leads in mobile monetizationAccording to Statista global revenue from mobile advertising almost doubled in 2012, increasing from $4.9 billion back in 2011 to $9.1 billion.

In North America alone, the amount spent on mobile ads per mobile subscription reached $9.39 on 2012 compared to $4.53 on the previous year. That fact puts North America as the leader in mobile advertising worldwide. Western Europe follows with $2.91 spent on mobile ads per mobile subscription, more than double the amount spent on the previous year.


People Living with an HIV Diagnosis by U.S. County

people living with HIV diagnosis by countyOut of all the people in the United States who are HIV positive, up to one out of five are not aware of their condition. That’s just one of the interesting results highlighted by AIDSVu while preparing its most recent study.

The map above shows the number of people infected by the HIV virus per 100,000 people by county in the United States. The darkest red areas show the highest number of adults and adolescents with an HIV diagnose, 386 or more per 100,000 population. These numbers are concentrated along the East coast and Southern parts of the United States.

Source: AIDSVu: Persons Living with an HIV Diagnosis, 2010


Cannabis Consumption by Country

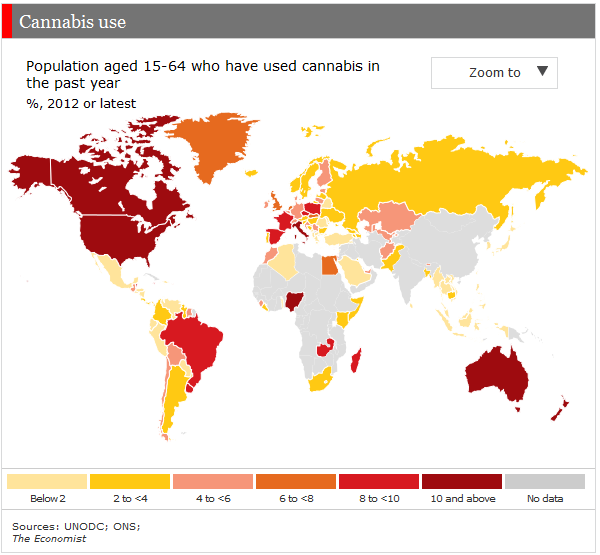
use of cannabis worldwideUruguay is on its way to legalize the production and consumption of cannabis, only waiting for the senate to pass the new bill. According to The Economist, more than 8% of Uruguay’s population ages 15 to 64 smoked cannabis in 2011, a higher percentage than in previous years.

Consumption of cannabis has also increased worldwide. Countries with the highest levels of consumption of cannabis in 2012, 10% or more of the population, include Italy, Nigeria, Australia, the United States, and Canada.


Total Population Undernourished in 2012

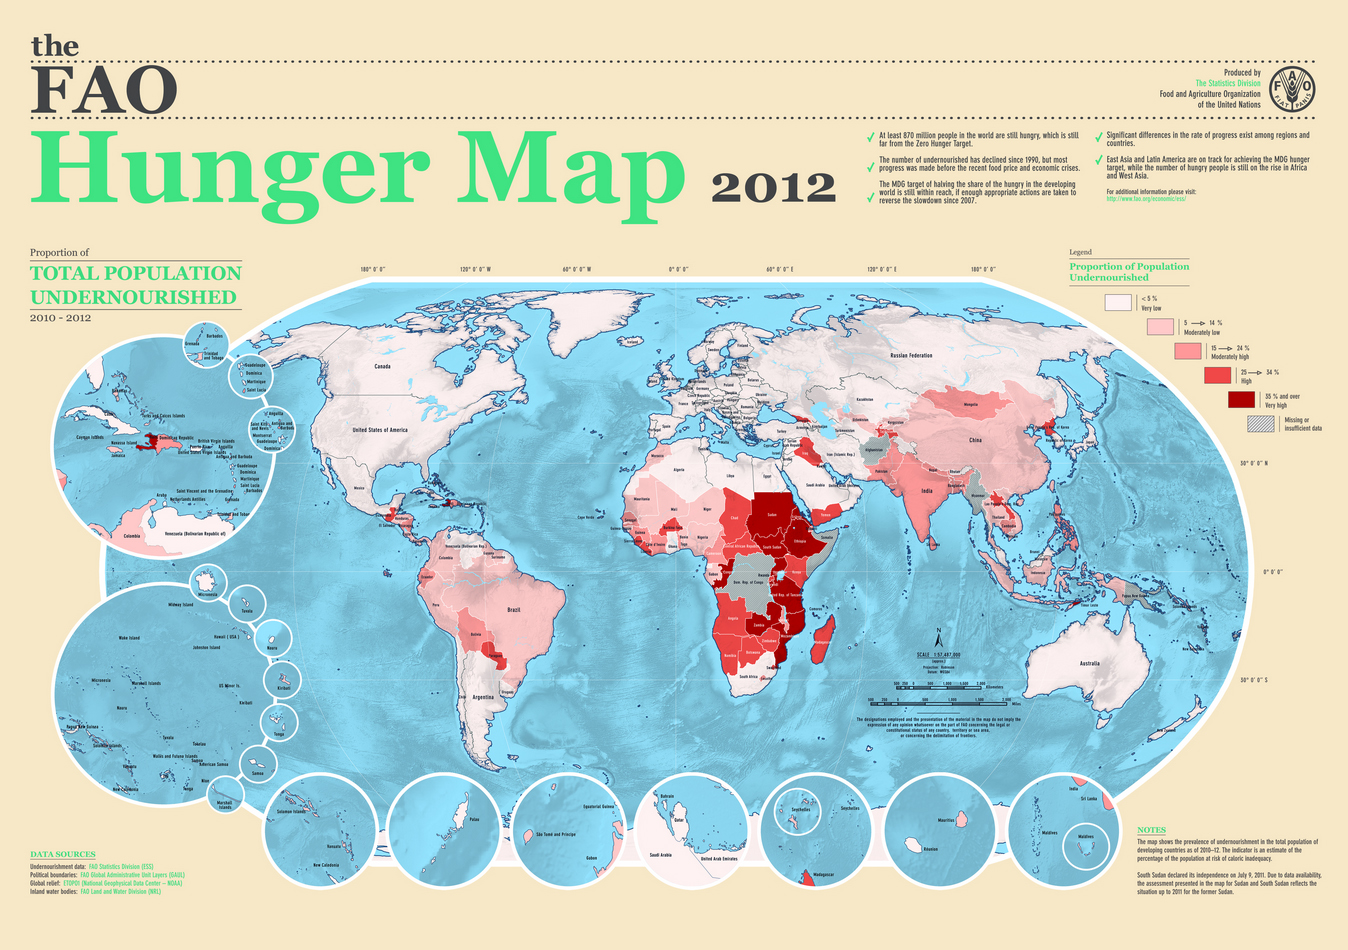
undernourishment hunger map 2012About 870 million people are still undernourished around the world, specially in developing countries. Undernourishment is defined as the lack of sufficient caloric intake.

The situation is specially serious in Africa. In countries like Sudan, South Sudan, Eritrea, etc. more than 35% of the population is undernourished. Other countries where a high percentage of the population is undernourished include North Korea, Laos, Paraguay, Haiti, to name a few.

Source: Food and Agriculture Organization of the United Nations: The FAO Hunger Map 2012


Bribes Around the World

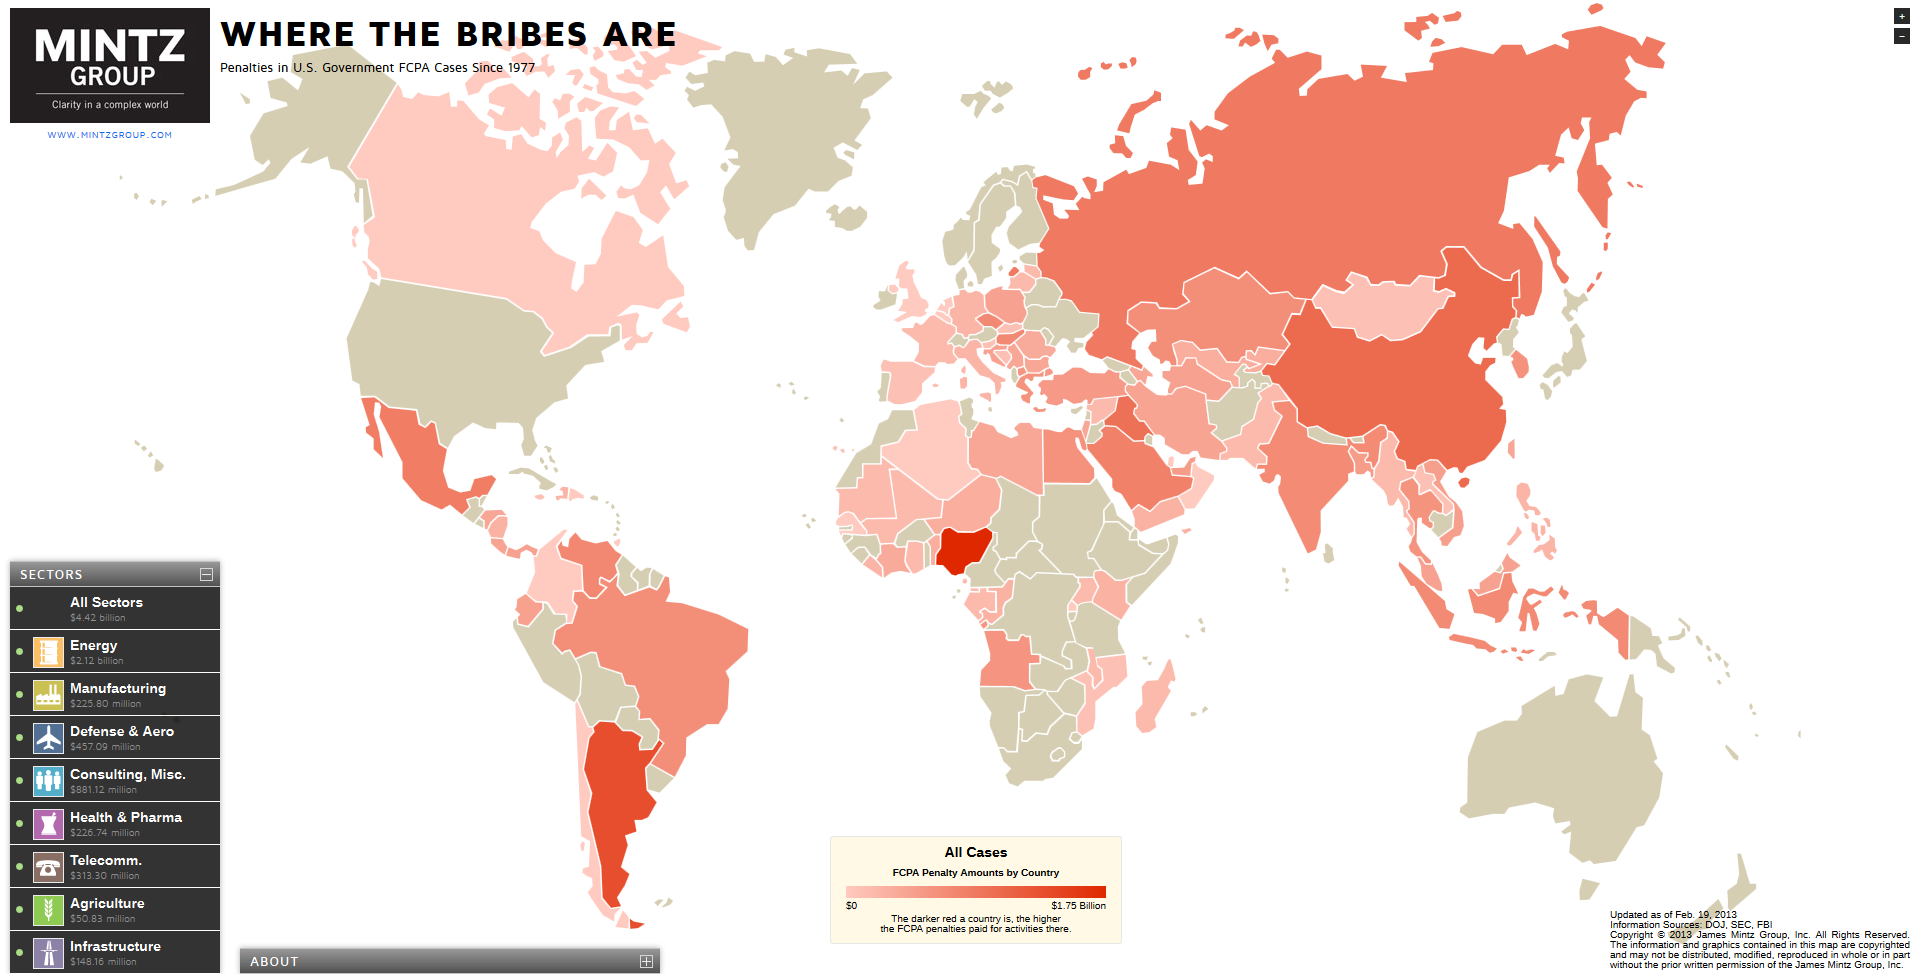
where the bribes areThe Foreign Corrupt Practices Act (FCPA) of 1977 was enacted for the purpose of making it illegal for individuals or entities to make payments to foreign government officials in order to obtain business in a particular country. So far about 200 FCPA violations have been covered in 80 countries.

The darker the color of a country on the map above, the larger the FCPA violations in that country. FCPA violations have been found in different economic sectors: energy, manufacturing, agriculture, consulting, health and pharmaceuticals, telecommunications, defense and aerospace, and infrastructure.

The country with the largest number of FCPA violations is Nigeria, with the majority of bribery cases in the energy sector. Nigeria is followed by Argentina, China, Russia, Iran, and Iraq.

For the interactive map and links to documentation for every FCPA violation, please visit: The Mintz Group: Where the Bribes Are – Penalties in U.S. Government FCPA Cases Since 1977


Oil Production and Consumption by Country

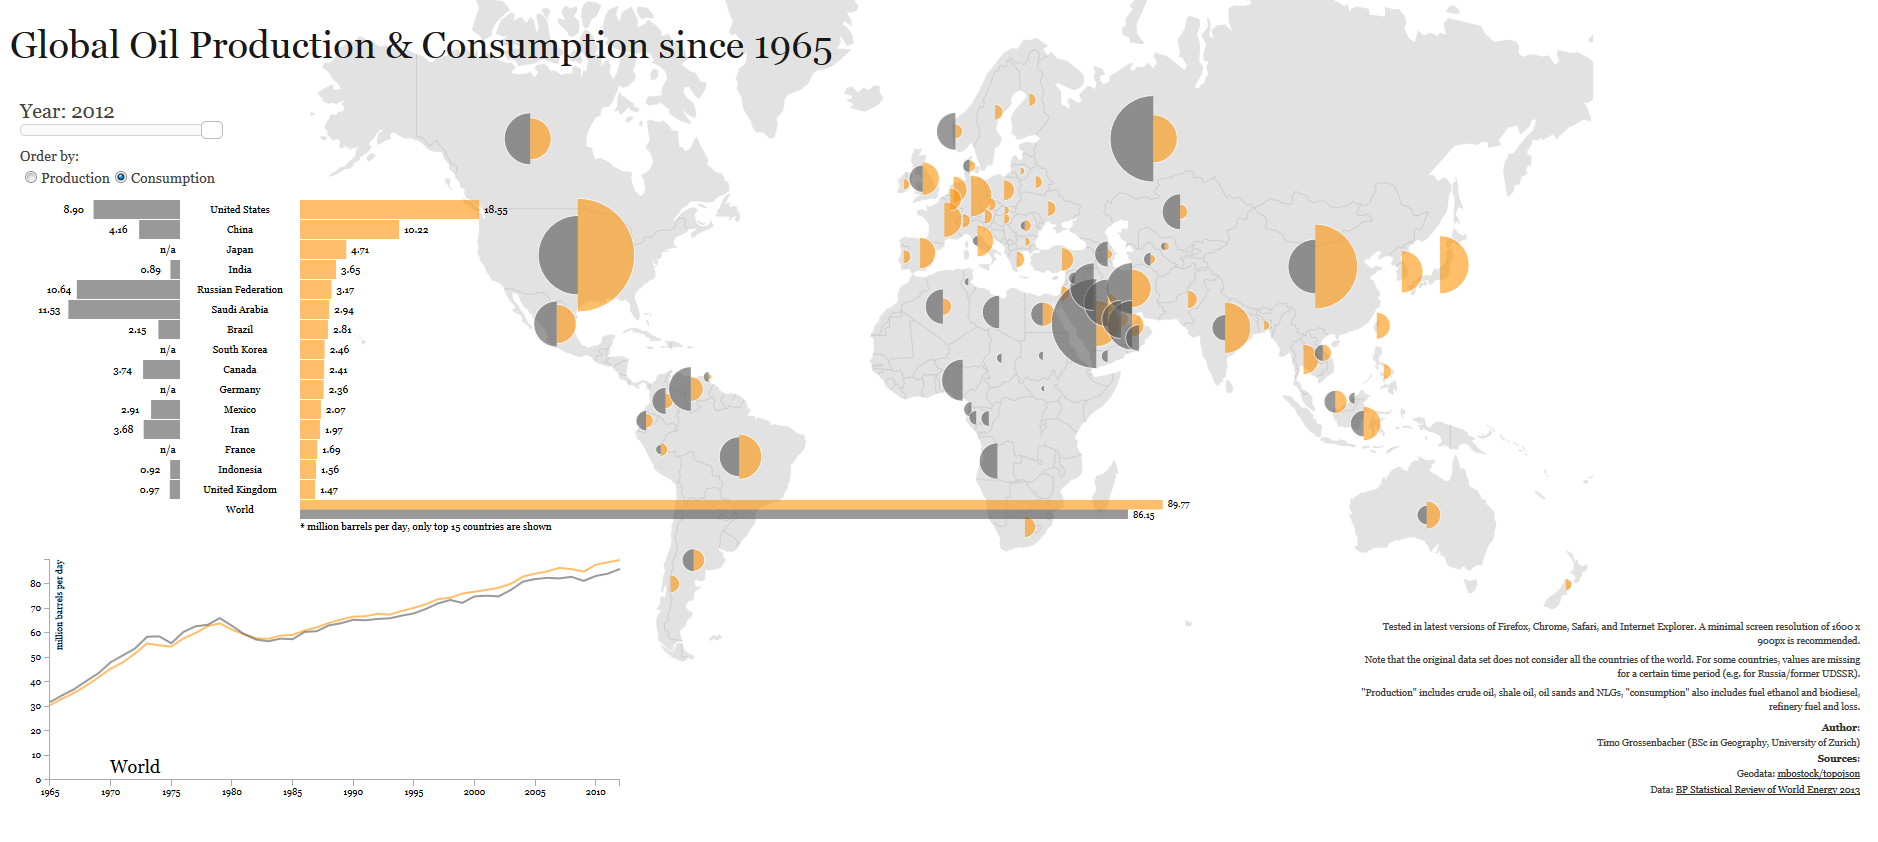
oil production and consumption since 1965When it comes to oil production and consumption, countries have a very close relationship of interdependence with each other. Some countries consume more oil than what they produce relying on imports to satisfy their internal demand. Others, consume less than what they produce, being able to export oil to nations that need it.

Oil consumption (yellow) for the United States, for example, was larger than its production (grey) for 2012, 18.55 mb/d (million barrels per day) compared to 8.9 mb/d, importing more than double its production to satisfy the gap in internal demand. Other nations with oil consumption higher that oil production include China, Brazil, Australia, India, UK, and Indonesia.

In contrast, oil consumption for Saudi Arabia for 2012 is estimated at 2.94 mb/d, while its production reached 11.53 md/d, exporting its oil surplus to the rest of the world. Other nations whose oil production exceeds its oil consumption include Canada, Mexico, Venezuela, Norway, Russia, Kuwait, United Arab Emirates, and Qatar.

Source: Winston Smith Labs: Global Oil Production and Consumption since 1965 [Interactive Map/Graph]


The Quality of Democracy by Country

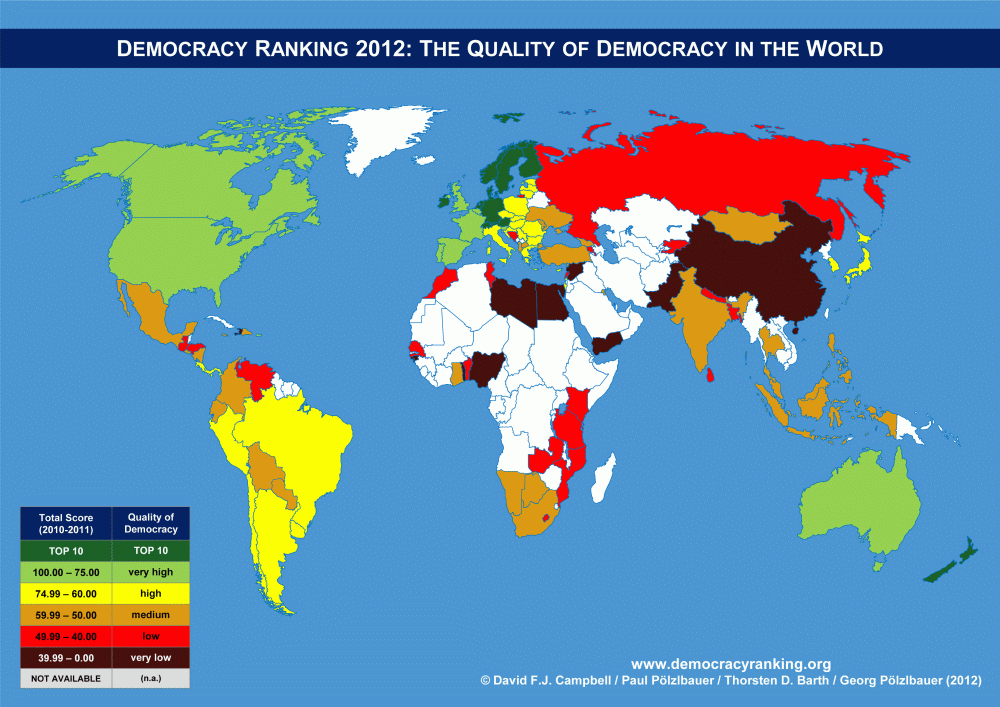
democracy ranking worldmap 2012Global Democracy Ranking released the Democracy Ranking for the year 2012, which shows the quality of democracy around the world.

Several indicators were used to calculate the Global Democracy Ranking. Those indicators were selected from a vast variety of dimensions such as politics, economy, environment, gender equality, education, health, and knowledge.

As seen in the map above, countries ranked at the top (dark green), those with the highest quality of democracy include Norway, Sweden, Finland, Switzerland, Denmark, Netherlands, New Zealand, Germany, Ireland, and Austria. In contrast, we find countries where democracy is at serious risk or where it is no longer a viable system (brown). Among these countries we have Yemen, Syria, Libya, Togo, Guinea-Bissau, China, Pakistan, Egypt, Nigeria, and Haiti.

Source: Global Democracy Ranking: Democracy Ranking 2012