Category Archives: Debt

The United States vs. China

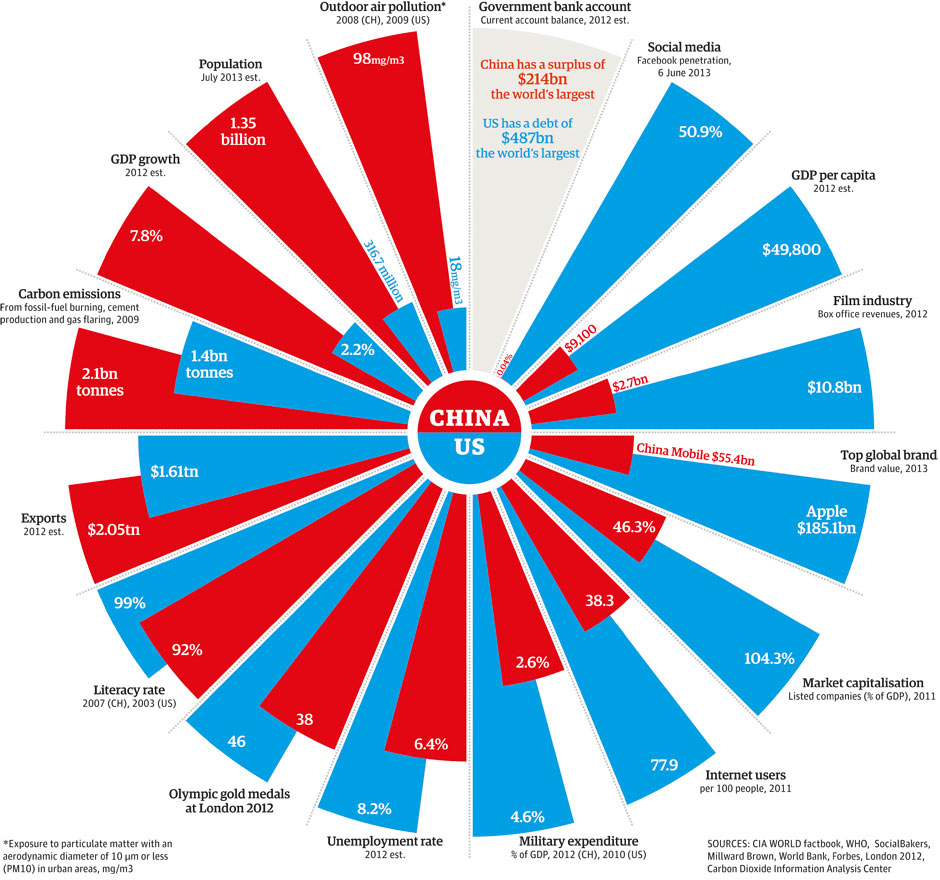
US and China compared - final graphicThe Guardian created this comparison of the U.S. and China, comparing several indicators such as GDP growth, GDP per capita, carbon emissions, exports, literacy rate, unemployment rate, military expenditure, outdoor pollution, to name a few.

The US is ahead of China in terms of literacy rate, number of internet users, military expenditure as a percentage of GDP, unemployment rate, GDP per capita, market capitalization, and social media. On the other hand, China is ahead of the U.S.  in terms of exports, GDP growth, number of people, carbon emission, and outdoor pollution.

While the U.S. has the largest deficit in its current account, China has the largest surplus.
Government Debt as a Percentage of GDP

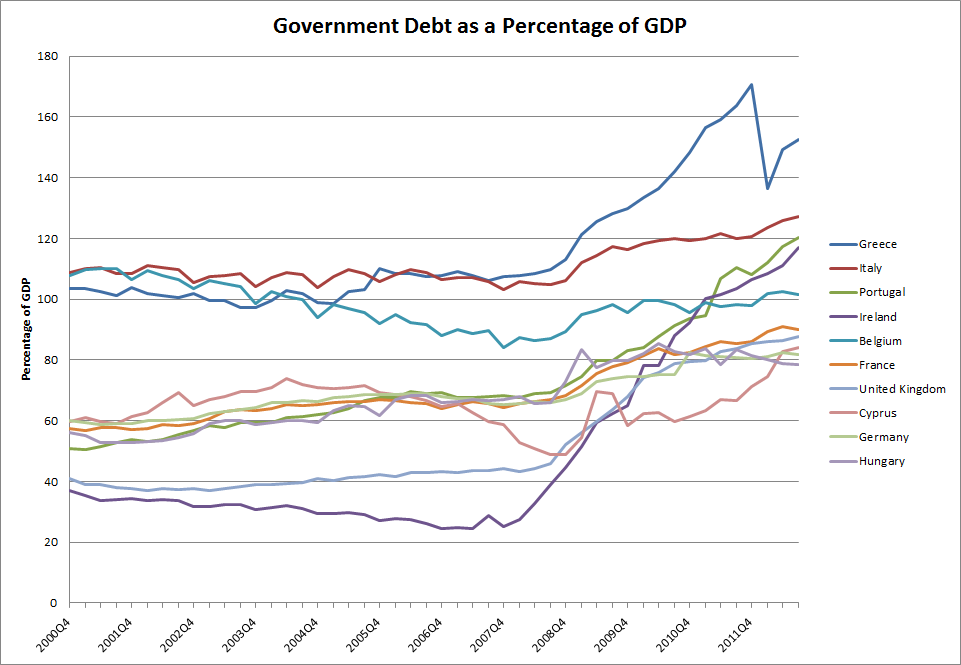
Government Debt as a Percentage of GDP

Using data from Eurostat, we identified the top 10 European countries with the highest government debt as a percentage of GDP. The chart above shows that as of the third quarter of 2012, the latest period for which quarterly data is available, Greece, Italy, and Portugal had the highest government debt ratio. Ireland was close behind Portugal, with a ratio that has been increasing at the fastest rate out of all the countries in the list. Cyprus, which has been in the news lately due to problems in its banking sector, had a debt ratio not much higher than Germany.

Source: Eurostat

The Global Public Debt Clock is Ticking

click to enlarge

Global public debt is increasing every second. This debt clock shows government debt, in dollar terms, for almost all countries. Governments with the highest debt include the United States, Canada, Brazil, Australia, India, China, and several western European nations.

Additional indicators such as public debt per person, public debt as percentage of GDP, total annual debt change, and country debt comparisons can be seen in the interactive map at: The Economist: The global debt clock


Total Consumer Credit Outstanding in the US

A sobering graph from the St. Louis Fed shows the total consumer credit outstanding in the US. It’s clear from the graph that consumer borrowing went into overdrive starting in the early 1990s. The big question for creditors now is how much of the borrowed money will be paid back while unemployment continues to increase.

Total consumer credit outstanding in the US

Source: Federal Reserve Bank of St. Louis