Category Archives: Demographics

Women’s Earnings by State

gender-pay-gap-graphic-final

Comparing the median earnings of full-time employed women to the median earnings of full-time employed men in the U.S., we can see there is still a gender pay gap, where women earn 77 cents per each dollar earned by their white male counterparts. This number has remained unchanged for the last ten years.

In some states women earn slightly more. That is the case for the states of Nevada (84 cents per dollar), California, Vermont, and New York. On the other side of the spectrum, there are states where women earn much less than the median. That is the case of Wyoming (64 cent per dollar), and Louisiana (67 cents per dollar).

Source: Forbes: The Geography Of The Gender Pay Gap: Women’s Earnings By State


Hardworking People in the World

hardworking people in the world

In some countries people work really hard and in others they don’t. In the map above we can see that countries where people are the most hardworking (orange) include Mexico, South Korea, and Chile, while countries where people just take it easy (blue) include France, Germany, Italy, and Norway.

This map was elaborated for OECD countries only. To get this numbers the author took into consideration the average annual hours worked per person and the average age of retirement per worker for each OECD country.

Source: Business Insider: MAP: Here Are The Countries That Work Hard And The Ones Where They Like To Relax


Syrian Refugees in 2013

syrian-refugees

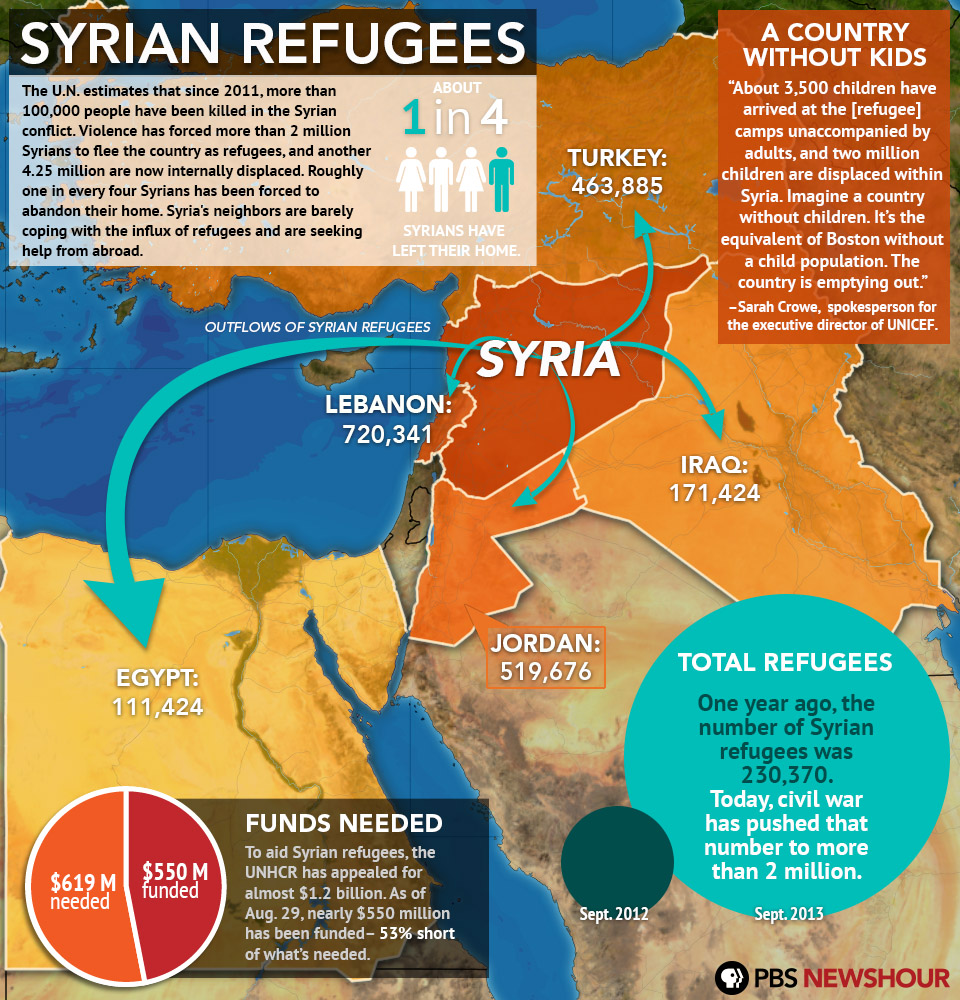
Since the armed conflict began in Syria, an estimated 100,000 people have been killed, and as many as 2 million people had fled the nation seeking refuge in neighboring countries. The majority of the refugees had fled to neighboring Lebanon, Turkey, and Jordan. Egypt and Iraq have seen an influx of Syrian refugees as well.

Additionally, another 4 million people had been internally displaced, roughly 1 of every 4 inhabitants, including an estimated 2 million children.

Source: PBS: Syrian Refugees


Unplanned Pregnancy By State Across the United States

2013_09_UnintendedPrenancies

Nearly half of the total 6.7 million of pregnancies taken place in the United States every year are unintended pregnancies. Although the unintended pregnancy rate has remained relatively constant in the last three decades, the rate among poor women has seen a dramatic increase, especially in the South, and in cities with a large population.

Public funds are used to cover the huge cost of such unintended pregnancies. Avoiding unintended pregnancies though the funding of public family planning centers constitutes a better use of those funds. In 2008, $1.9 billion were destined to fund public family planning centers across the U.S., which resulted in savings of $7 billion, resources that would have been used to cover for the unintended pregnancies otherwise.

Source: The Huffington Post: The Geography Of Unintended Pregnancy (INFOGRAPHIC)


The Most and Least Ethnically Diverse Countries

diversity map harvardUsing data from the Harvard Institute for Economic Research, The Washington Post created this map that shows how ethnically diverse is a country.

Dark green countries are the more ethnically diverse. Such is the case of Canada, Mexico, several South American countries, including Peru, Bolivia, and Ecuador. The most ethnically diverse countries are located in Africa. In contrast, dark orange countries are more ethnically homogenous. That is the case of most European nations, China, Japan, South and North Korea, and Australia.


Total Population Undernourished in 2012

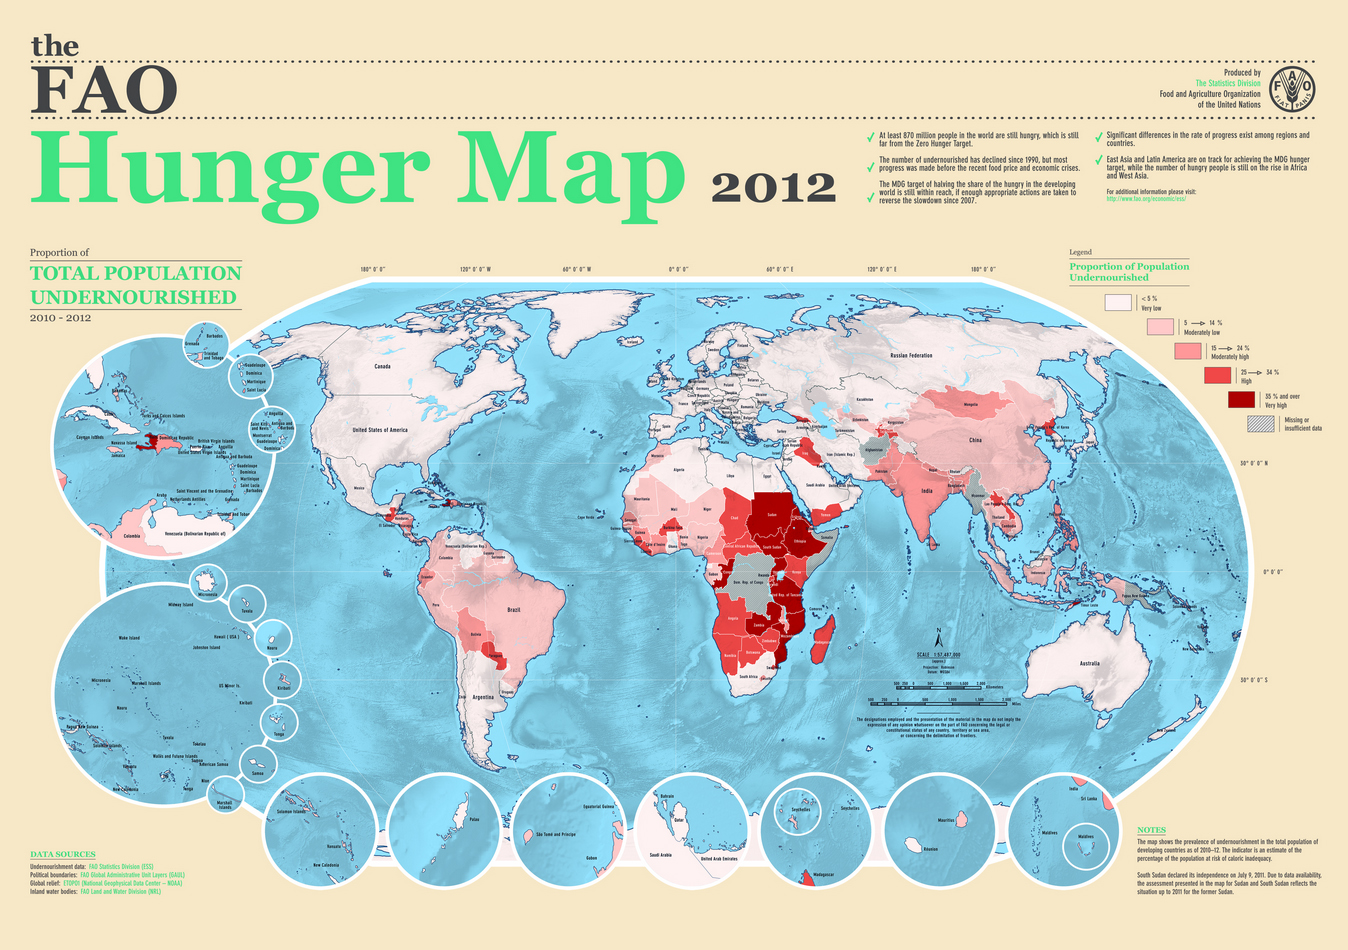
undernourishment hunger map 2012About 870 million people are still undernourished around the world, specially in developing countries. Undernourishment is defined as the lack of sufficient caloric intake.

The situation is specially serious in Africa. In countries like Sudan, South Sudan, Eritrea, etc. more than 35% of the population is undernourished. Other countries where a high percentage of the population is undernourished include North Korea, Laos, Paraguay, Haiti, to name a few.

Source: Food and Agriculture Organization of the United Nations: The FAO Hunger Map 2012


The Failed States Index 2013

failed state index 2013Fund For Peace just released the Failed State Index (FSI) 2013. The FSI measures the level of risk in each country using a series of risk indicators such as mounting demographic pressures, massive movement of refugees, uneven economic development, poverty, legitimacy of the state, progressive deterioration of human services, violation of human rights, violation of the rule of law, security apparatus, intervention of external actors, etc. The FSI is calculated for a total of 178 countries.

Nations ranking at the top for failed states (red) include Somalia, Congo, Sudan, and South Sudan. Unfortunately, most of the world’s nations seem to be under a warning (orange) for failed states, from Africa to Asia to Latin America.

For the complete list of countries, rankings and scores, please visit: Fund For Peace: Failed State Index (FSI) 2013


World Population Growth Over Time

population growth over time 1800-2050

World population growth accelerated in the last century. During the twentieth century alone, the number of people increased from 1.5 billion to 6 billion.

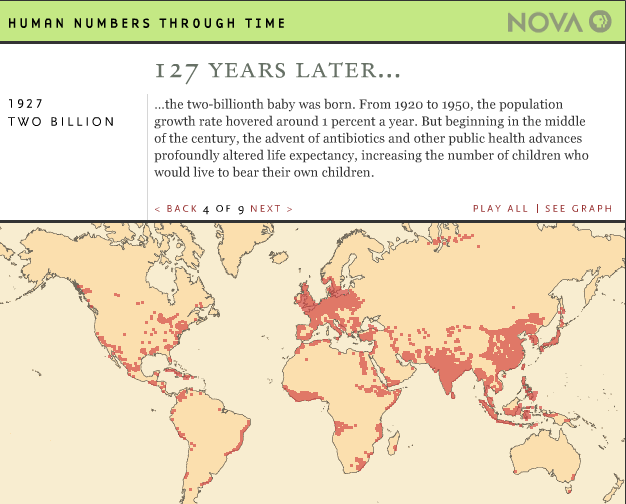
In the year 1800 the world’s population had reached 1 billion, with most people living in Asia and Europe. By 1927, 127 years later, the population of the world had doubled, reaching an staggering 2 billion people.

population growth over time 1927Population growth remained almost the same until 1950 when advances in science and medicine increased life expectancy, specially in developed nations.

The world’s population reached 3 billion inhabitants by 1960, 4 billion by 1974, 5 billion by 1987, 6 billion by 1999, 7 billion by 2011.

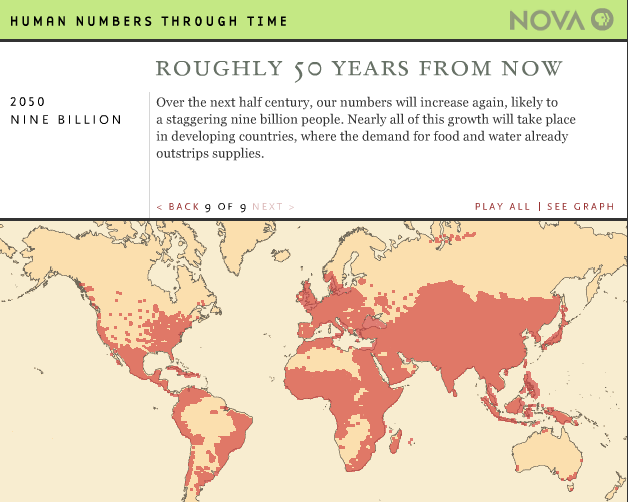
population growth over time 2050It is estimated that the population of the world will reach 8 billion by 2024, and 9 billion by 2050. Most of the growth will occur in developing nations

Source: NOVA: Human Numbers Through Time


The World’s Abortion Laws by Country

world abortion laws 2013Latin American countries along with countries in the Middle East and Africa have the most restrictive abortion laws.

According to this map by the Center for Reproductive Rights, in countries like Argentina, Brazil, Mexico, Venezuela, Syria, Iran, Iraq, Afghanistan, Yemen, Oman, Egypt, Libya, Indonesia, etc. (shown in red) abortions are allowed in some cases only to save a woman’s life, or in most cases they are banned altogether.

In general, most developed nations have less restrictive abortion laws, although some 12 states in the U.S. have passed more restrictive laws banning abortion after 20 weeks of gestation.


U.S. Abortion Laws by State

abortion laws by stateMost states (in orange) ban abortions during the last trimester of pregnancy when the fetus is already viable outside the womb.

However, since the state of Nebraska passed the most restrictive abortion law in a decade back in 2010 banning abortions after 20 weeks, 12 other states have passed similar laws as of March 2013. States that have passed even more restrictive abortion laws include North Dakota, that bans abortions afters 6 weeks of pregnancy, and Arkansas that bans abortions after 12 weeks.

For the interactive map, please visit: The Washington Post: The landscape of abortion bans, in one must-see map