Category Archives: Economics

Key Commodities and Emerging Markets

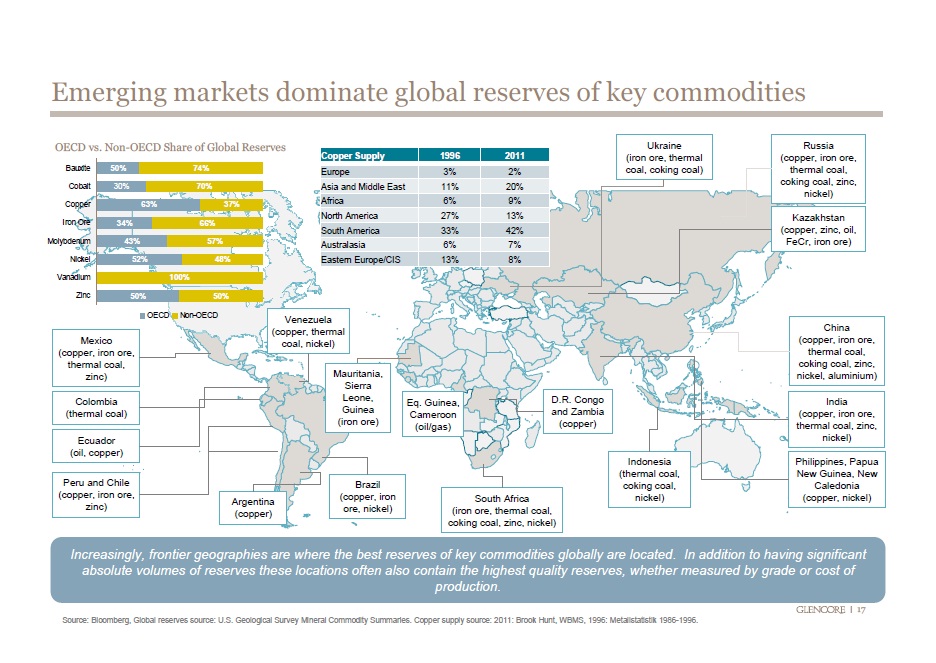
emerging market dominate commoditiesCommodities are raw materials essential for the production of more complex products. Commodities fall into three large categories: agricultural, energy, and metals.

According to this visualization, emerging economies (Brazil, Russia, India Indonesia, China, South Africa, etc.) have the largest reserves of certain key energy and metal commodities such as oil, coal, copper, cobalt, iron ore, molybdenum, nickel, zinc, and aluminum.

Source: Business Insider: 36 Maps That Explain The Entire World


Percentage of the Population Living on $2 or Less a Day

surviving on a few dollars per day worldMIT economists Abhijit V. Banerjee and Esther Duflo, conducted surveys in developing nations to see which countries survive on a few dollars per day. The cities or countries where people are known to live on meager dollar amounts on a daily bases are not that surprising, but the percentage of the population living under these conditions is.

In Udaipur and Hyderabad (India) a staggering 94% of the population survive on $2 or less per day. In Bangladesh, 69.4% go on $2 or less per day. In Ghana, 67.7% survive on $2 or less per day. In Guatemala, 64.8% of the population survive on $2 or less per day.

Source: GOOD: Living on Less


The World’s Largest Oil Reserves by Country

strategic oil reserves worldOil reserves are the amount of oil that can be technically and economically recovered from the ground.

Nations with the world’s largest oil reserves include Saudi Arabia, Venezuela, Iran, Iraq, Kuwait, United Arab Emirates, Russia, and Libya. Saudi Arabia, holds an approximate 234.5 billion barrels of oil reserves, and it has the largest market share for oil production after Russia. Saudi Arabia is followed by Venezuela, with an estimated 211.0 billion barrels of oil reserves, although its current oil production market share is only 3.2%.

By comparison, the United States has an estimated 30.9 billion barrels in oil reserves, and  8.7% market share in oil production.

Source: Spiegel Online: A World without Oil: Companies Prepare for a Fossil-Free Future


Women in the Workforce by Country

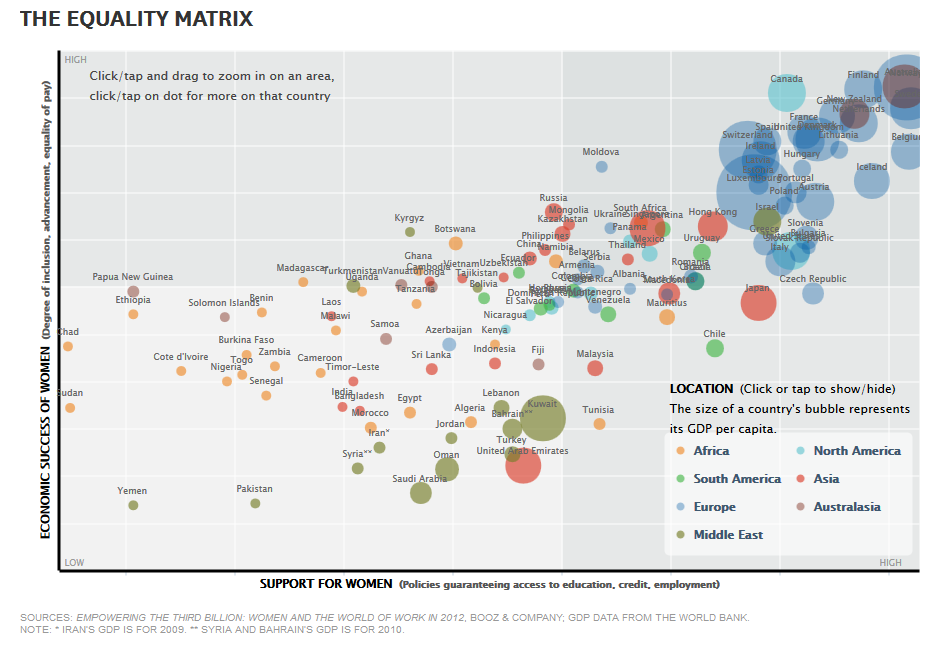
women and equality worldIt has been said, that if women participated in the workforce more actively, like their male counterparts, the Gross Domestic Product (GDP) of those countries would be higher.

However, most countries, including some developed nations do not have policies in place that support women’s participation in the workforce, such as access to education, credit, employment, paid maternity leave or child care.

Countries with the highest economic success for women (measured in terms of equality of pay, degree of inclusion in the workforce, and career advancement), that offer the best policies for supporting women in the workforce include Norway, Australia, Sweden, Finland, Germany, Belgium, and Iceland.

Countries with the lowest degree of economic success that have few policies (or none) that support women in the workplace include Chad, Sudan, Yemen, Pakistan, Syria, Saudi Arabia, among others.
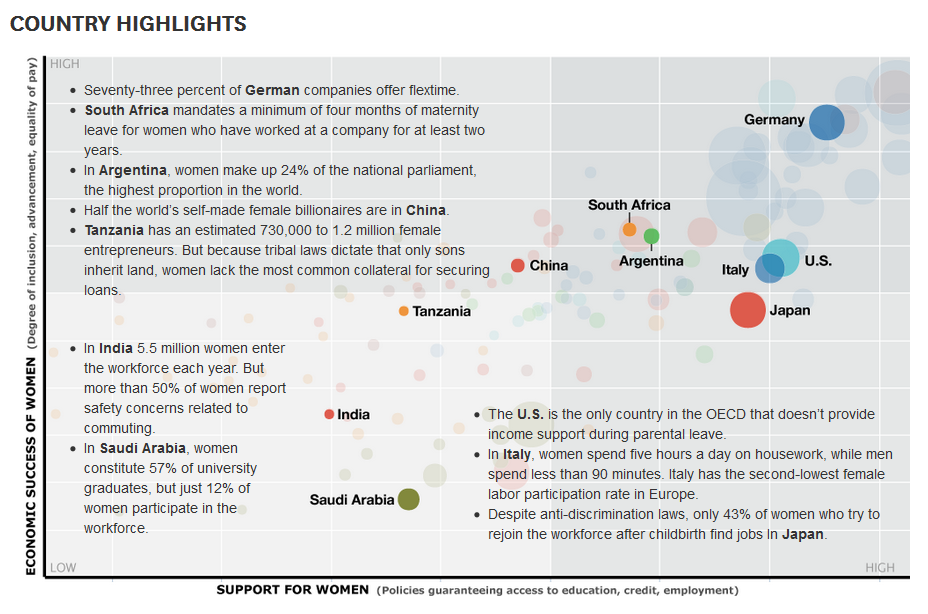
women and equality world 2Some interesting facts about the success of women in the workplace and the policies in place to support them in certain countries can be seen in the graphic above.

Source: Harvard Business Review: Vision Statement: Women and the Economics of Equality
 

Gasoline Prices in Europe by Country

According to Russian news agency Ria Novosti, Norway has the highest gasoline price among European countries, with a price of 1.90 Euro per liter ( or US $9.475 per gallon at the current exchange rate of 1 Euro = US $1.31). Norway is followed by Italy, Netherlands, Sweden, and Greece.

The lowest gasoline prices are found in Belarus and Kazakhstan, 0.68 Euros and 0.70 Euros per liter, respectively. The average gasoline price for European nations is 1.39 Euros per liter.


Internet Connectivity in the United States

As part of the PBS series America Revealed, this aerial visualization shows the patterns of internet distribution in the United States. We can see that the regions with highest levels of internet connectivity include the Northeast, and parts of the South and Midwest, followed by the Pacific West.

For additional interesting aerial visualizations, such as the distribution of the unemployed, electricity network routes, public transportation paths, U.S. imports and exports of beef patterns, the distribution of the population in towns and cities, etc., visit: The Roosevelt’s – Aerial Data Visualisation Reveals Life In The United States.

North Korea vs. South Korea

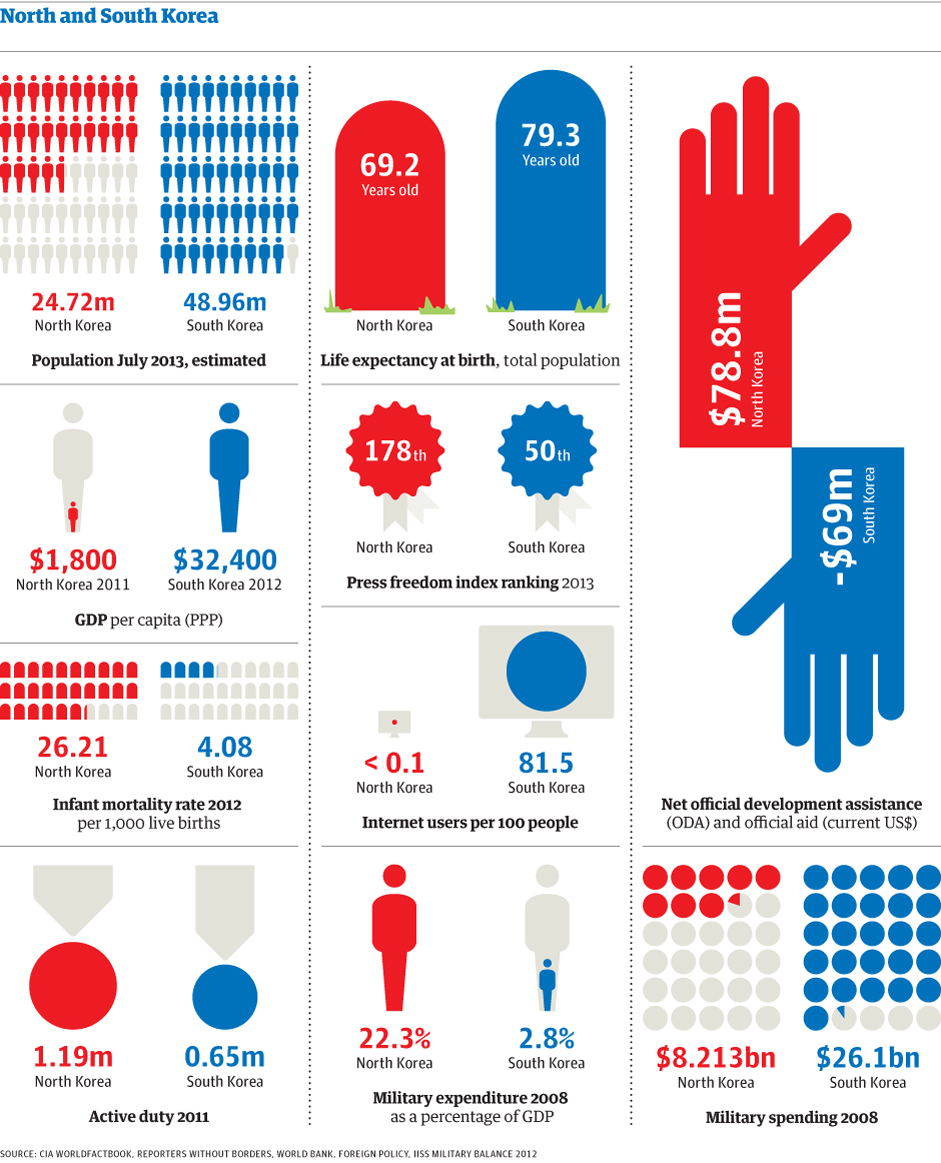
In this visualization created by The Guardian, we can see how North Korea compares to South Korea in terms of population, Gross Domestic Product (GDP), life expectancy, freedom of the press, military spending, internet connectivity, infant mortality, among other indicators.

North Korea is a poor country with half the population of South Korea. It is one of the worst countries in terms of corruption and freedom of the press. Its military spending constitutes approximately 22.3% of its GDP, compared to 2.8% for South Korea.

Additional resource: IndexMundi: South Korea vs. North Korea – Country Comparisons


Human Development Index 2012

The Human Development Index (HDI) is a composite measure that includes three indicators: life expectancy at birth, level of education attained, and income. The HDI is an alternative to the purely economical GDP, that quantifies economic growth only. Thus, the HDI provide a way to gauge the development of a country. The HDI for 2012 includes 187 countries.

The HDI ranks countries according to their degree of development using a scale from 0 to1, 0 being the least developed and 1 being the most developed country.

In the HDI map above, published by the Brazilian media site Globo.com we find that Norway has a score of 0.955, ranking number one as the most developed country (color green). Norway is followed by Australia, the U.S., the Netherlands, Germany, New Zealand, among others.

At the other end of the spectrum we find the least developed nations (color purple), including the majority of African nations, Pakistan, Afghanistan, Myanmar, Bangladesh, Nepal, and Papua New Guinea.


Billionaires and their Wealth by Country

This map of the world’s wealthiest citizens was created by Forbes. A total of 1,426 billionaires were found across the globe, worth $5.4 trillion combined.

The wealth of billionaires in the U.S. alone, 1,872.5 trillion, is larger than the combined wealth of billionaires in each continent. The wealth of the world’s richest in the Americas is an outstanding $2.4 trillion thanks to the contributions of billionaires mainly from the U.S., Brazil, Mexico, Canada, Chile, Colombia, Peru, and Venezuela.

The Americas are followed by Europe, where the wealth of its billionaires combined is valued at $1.55 trillion. Europe is followed by Asia with the wealth of its billionaires estimated at $1.16 trillion. Africa and the Middle East come at last, where the total net worth of its richest citizens is valued at $279 billion.


Government Debt as a Percentage of GDP

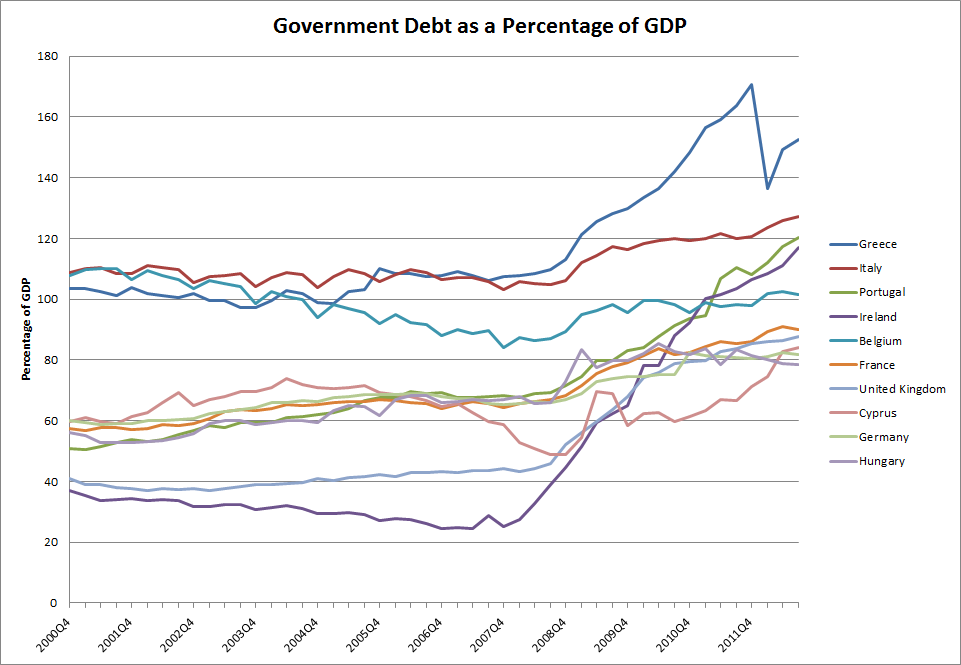
Government Debt as a Percentage of GDP

Using data from Eurostat, we identified the top 10 European countries with the highest government debt as a percentage of GDP. The chart above shows that as of the third quarter of 2012, the latest period for which quarterly data is available, Greece, Italy, and Portugal had the highest government debt ratio. Ireland was close behind Portugal, with a ratio that has been increasing at the fastest rate out of all the countries in the list. Cyprus, which has been in the news lately due to problems in its banking sector, had a debt ratio not much higher than Germany.

Source: Eurostat