Category Archives: Economics

The United States of Walmart

click to enlarge

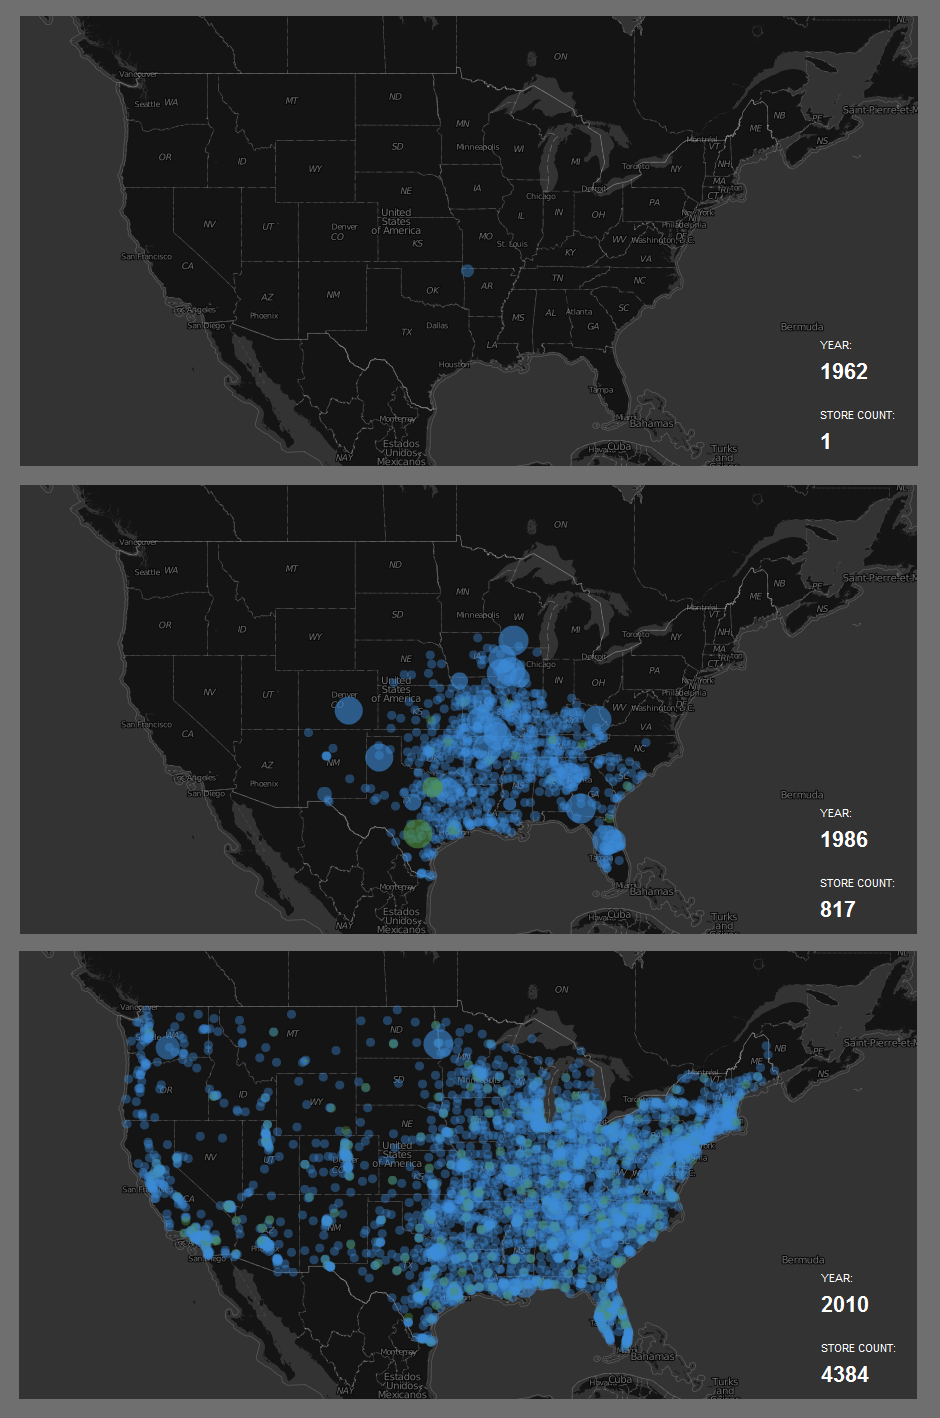
Walmart opened its first store in Rogers, Arkansas, back in 1962. From there it spread slowly through the South East. By 1986, twenty five years later, Walmart had 817 stores in the continental U.S. As of 2010, Walmart had 4,384 stores covering the entire country, including Hawaii, Alaska and Puerto Rico, but heavily concentrated in the East Coast and part of the Mid West.

Walmart is the world’s third largest public corporation, preceded only by Dutch Shell Company y Exxon Mobil.

For the interactive map, visit: Flowing Data: Watching the growth of Walmart
 

Migrant Remittances Continue to Rise

click to enlarge

click to enlarge

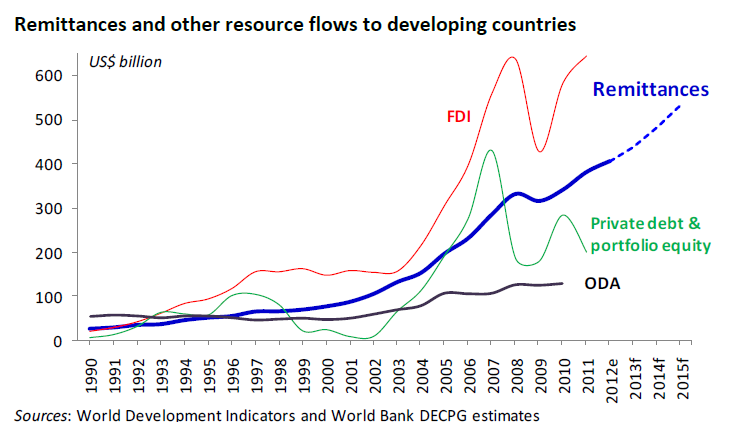
Migrant remittances to developing countries are expected to reach $406 billion in 2012, a 6.5 percent increase over the previous year, and $534 billion in 2015. These officially recorded remittances have kept increasing despite high remittance costs and the financial crisis. This source of income for developing economies constitutes more than three times the size of Official Development Assistance (ODA).

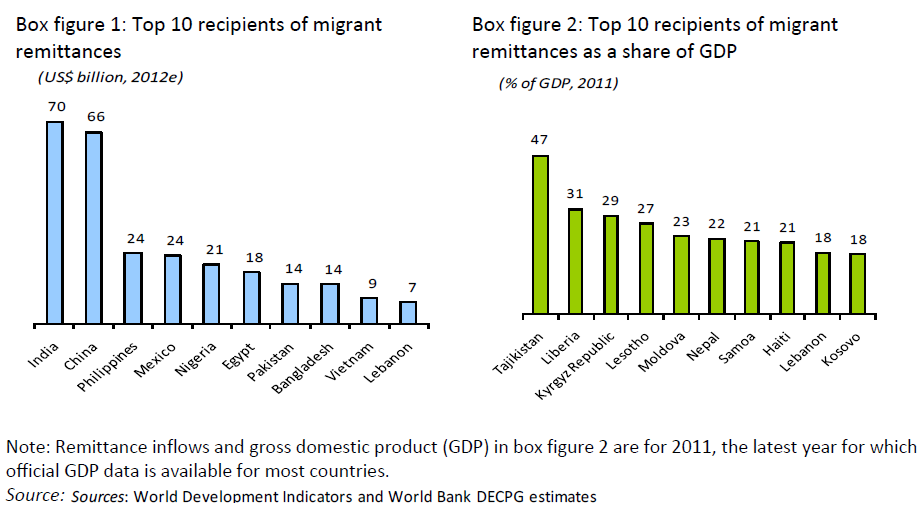
The highest recipients of migrant remittances among developing economies for 2012 are India, China, the Philippines and Mexico. As a percentage of GDP, the highest recipients in 2011 were Tajikistan, Liberia, the Kyrgyz Republic and Lesotho.

Resources:


The World’s Least and Most Dynamic Countries

Global Dynamism Index

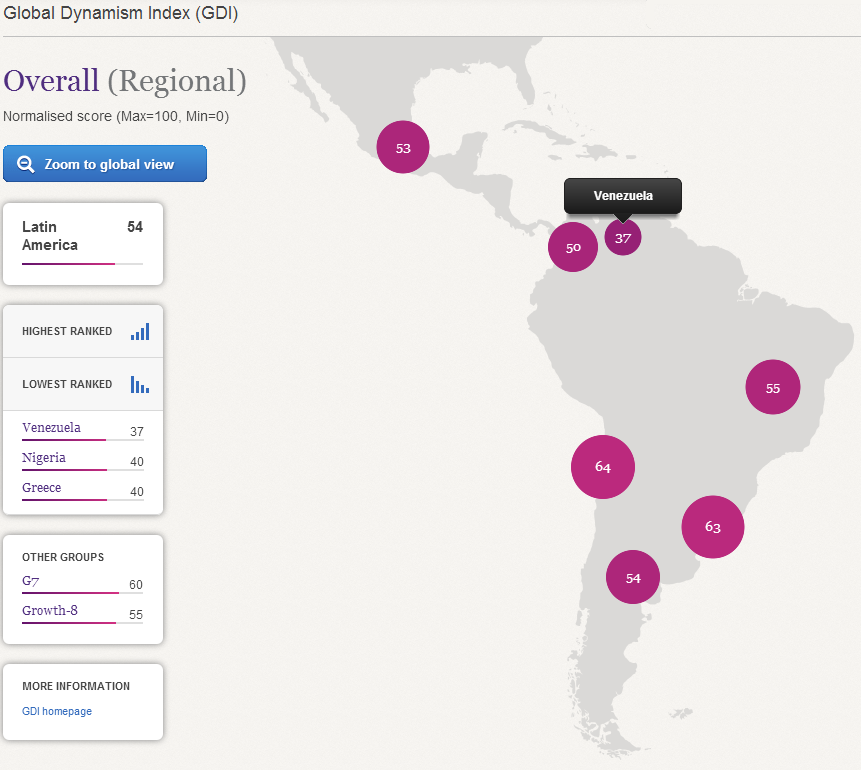
Grant Thornton International and the Economist Intelligence Unit have just released a Global Dynamism Index, which ranks 50 economies on 22 indicators of dynamism. Countries which have a positive reading on these indicators have recovered faster since the 2008 global recession, and are also on a path to higher future growth. Singapore, Finland, and Sweden are at the top of the list of the world’s most dynamic countries, whereas Nigeria, Greece, and Venezuela are at the bottom.

California’s Skyrocketing Gas Prices

click to enlarge

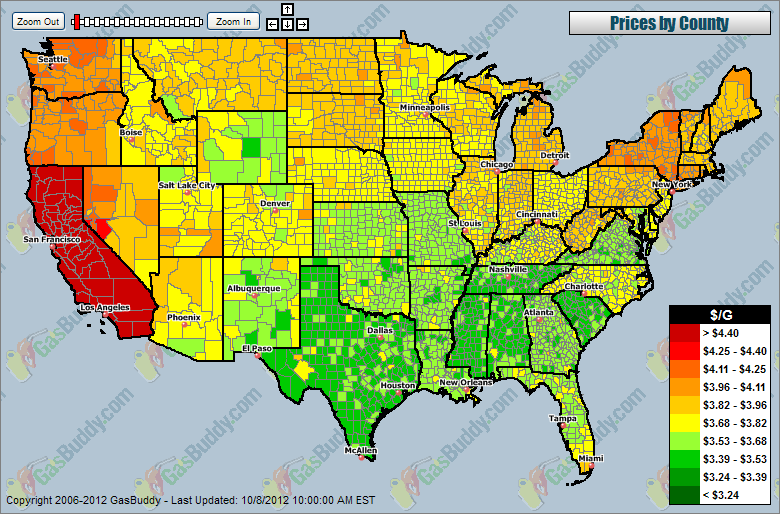
Gasoline prices in the U.S. have been rising lately, but for California the increase has been steeper. According to data of gas prices per county compiled by GasBuddy.com, prices in California are the highest in the U.S. California’s gas prices skyrocketed over the weekend due to supply disruption caused by a power outage to an Exxon Mobil plant in that state. As a result, regular gasoline reached an average record price of $4.614 per gallon.


Income Distribution by Religious Belief Groups

Click to enlarge

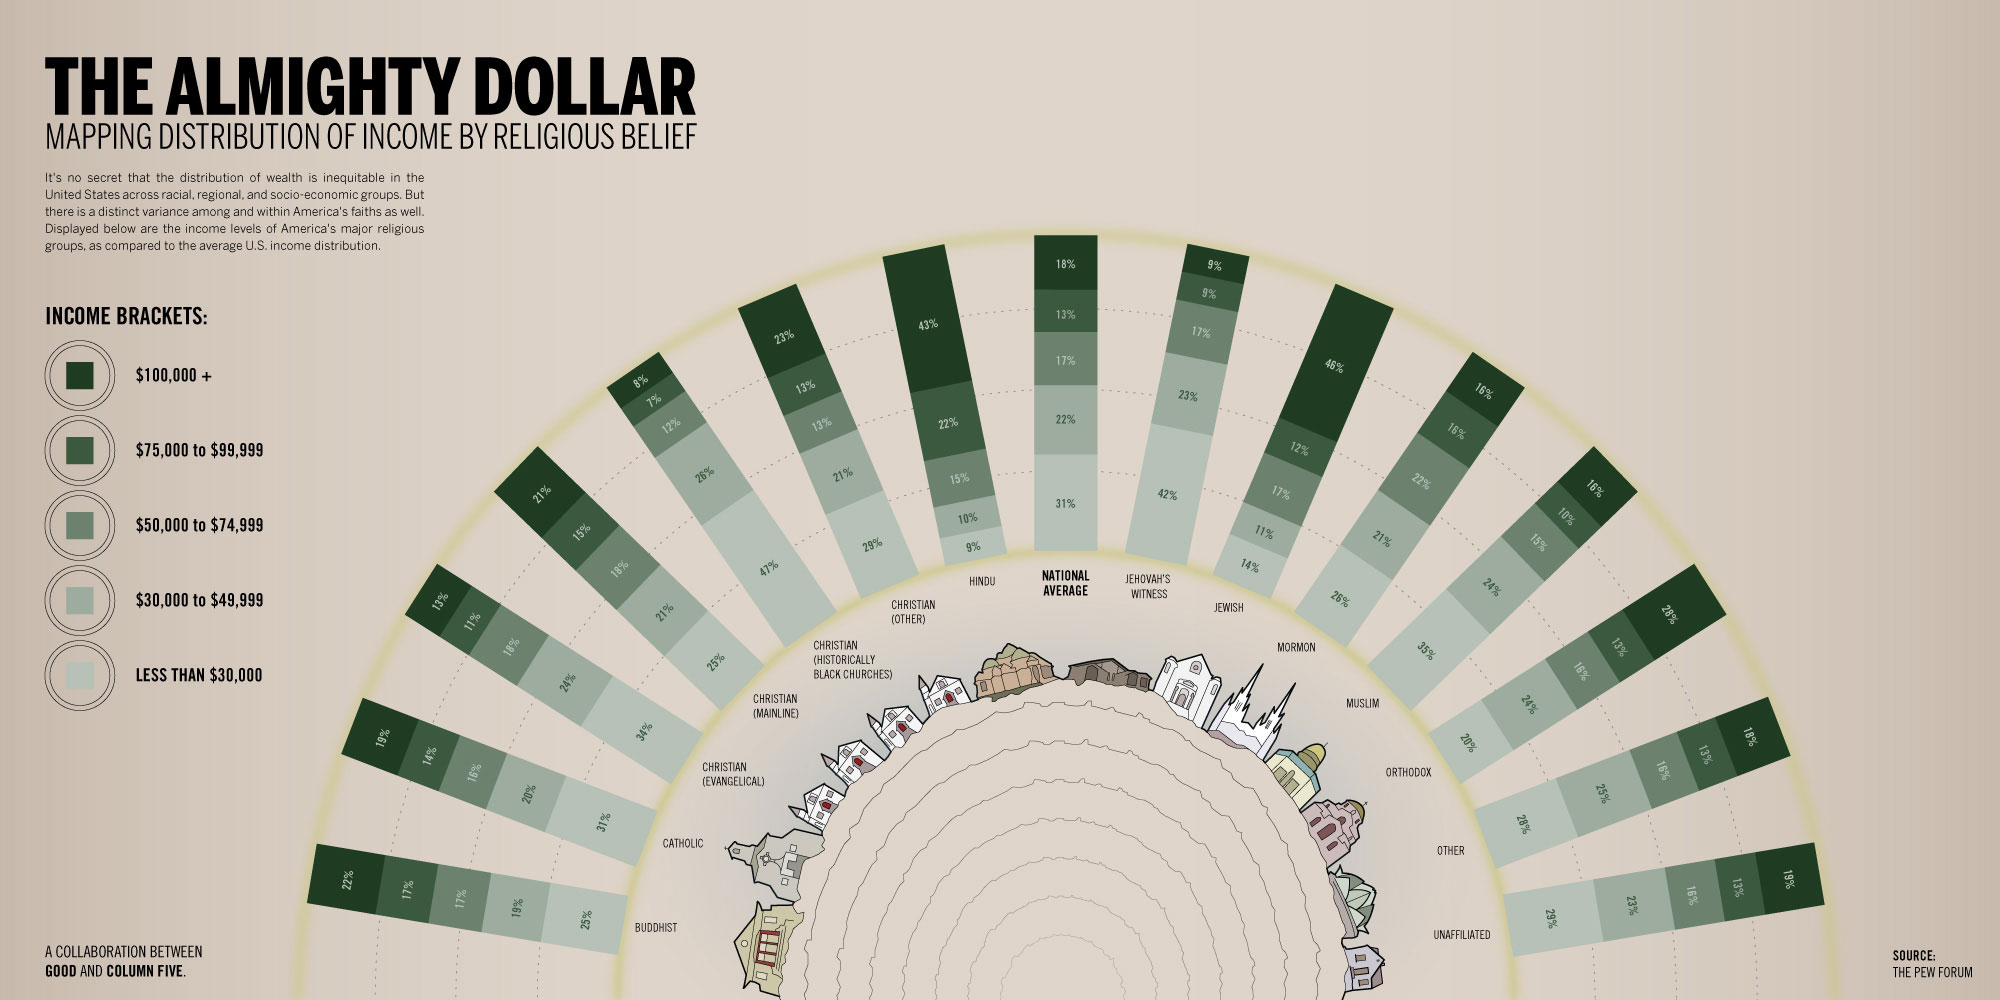
This infographic by GOOD shows the income distribution according to different religious belief groups. It is interesting to notice that 43% of people with Hindu beliefs earn an average income of 100K or more. For people with Jewish beliefs the percentage is 46%, compared to 21% for people with Christian beliefs (mainline), and 8% for people with Christian beliefs (Black churches). Click on the image for more detail.


How Many of Gallons of Gas Can You Purchase With Your Weekly Income?

Click to enlarge

The average weekly income in the US has been going up in the last fifty years, at least in nominal terms, as seen in the first graph. The price of a gallon of gas has been trending up as well, with spikes beginning in 2002 up to 2008, when gas prices decreased dramatically as a consequence of the economic recession. In 2010 gas prices increased again and continue rising to this day, as seen in the second graph. It is worth noting that the number of gallons of gas that can be purchased by a person earning an average income has been decreasing steadily since 1998.


Housing Market: Home Prices are Up!

The latest numbers for the S&P/Case-Shiller House Price Index, just released, show an increase in home prices for twenty major cities in the United States. Both the 20-City Composite and 10-City Composite show similar trends, the first with a 1.6% increase and the second with a 1.5% increase for the month of July 2012. This numbers constitute a second year-over-year rise, following a decline in 2010 caused by the end of the Housing Stimulus package in April of that same year.


How Does Your Country Compare to U.S. States?

These interactive maps from the Economist provide an interesting comparison between different countries and US states.

Using the criteria of GDP (Gross Domestic Product), the economy of California is approximately the size of Italy, Texas the size of Russia, Florida the size of the Netherlands, and Alabama the size of Nigeria.

Using the criteria of Population, California is approximately the size of Poland, Washington  the size of Lebanon, Arizona the size of Libya, and Minnesota the size of Finland, to name a few.


Poverty in the U.S.

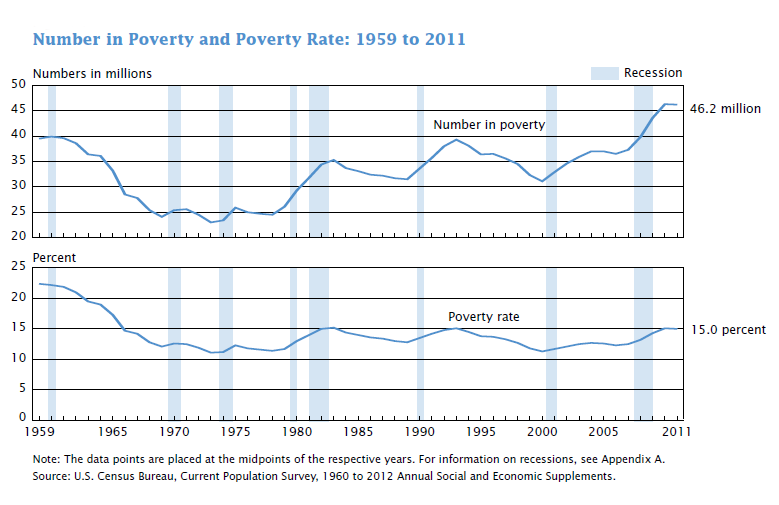
According to data just released by the U.S. Census Bureau, 15% of the population lives in poverty, that is 46.2 million of people. Those numbers are not statistically different from the 2010 estimates. In 2011 the poverty threshold for a family of four was $23,021.

The poverty rate for males decreased between 2010 and 2011 to 13.6%, and remained the same for females at 16.3%. The poverty rate for Hispanics declined between 2010 and 2011. By age, the group with the highest poverty rate was that of children under 18 at a rate of 21.9%. By region, the only region to show a significant change was the South with a decline in the poverty rate from 16.8% to 16.0%. Read more…


Industrial Production, Producer Prices and Consumer Confidence

Industrial production is up for the month of July, with a 0.6% increase. So is the core Producer Price Index (excludes energy and food) with an increase of 0.4%. Consumer confidence varies from state to state, with optimistic states located around the District of Columbia area and the Midwest, and pessimistic states mostly in the southern part of the country. Read below:

  1. Three Numbers to Watch: US Industrial Production,CPI; UK Unemployment – Yusuf Yassin [TradingFloor.com]
  2. Industrial Production Climbs 0.6% in July – Steve Goldstein [Market Watch]
  3. Producer Prices Come In A Bit Higher Than Expected – Sam Ro [Business Insider]
  4. Consumer Confidence Varies from State to State – Interview with Frank Newport [Marketplace]
  5. U.S. Durable Goods Orders Drop in June – Agence France-Presse [IndustryWeek]