Category Archives: Exports

Oil Production and Consumption by Country

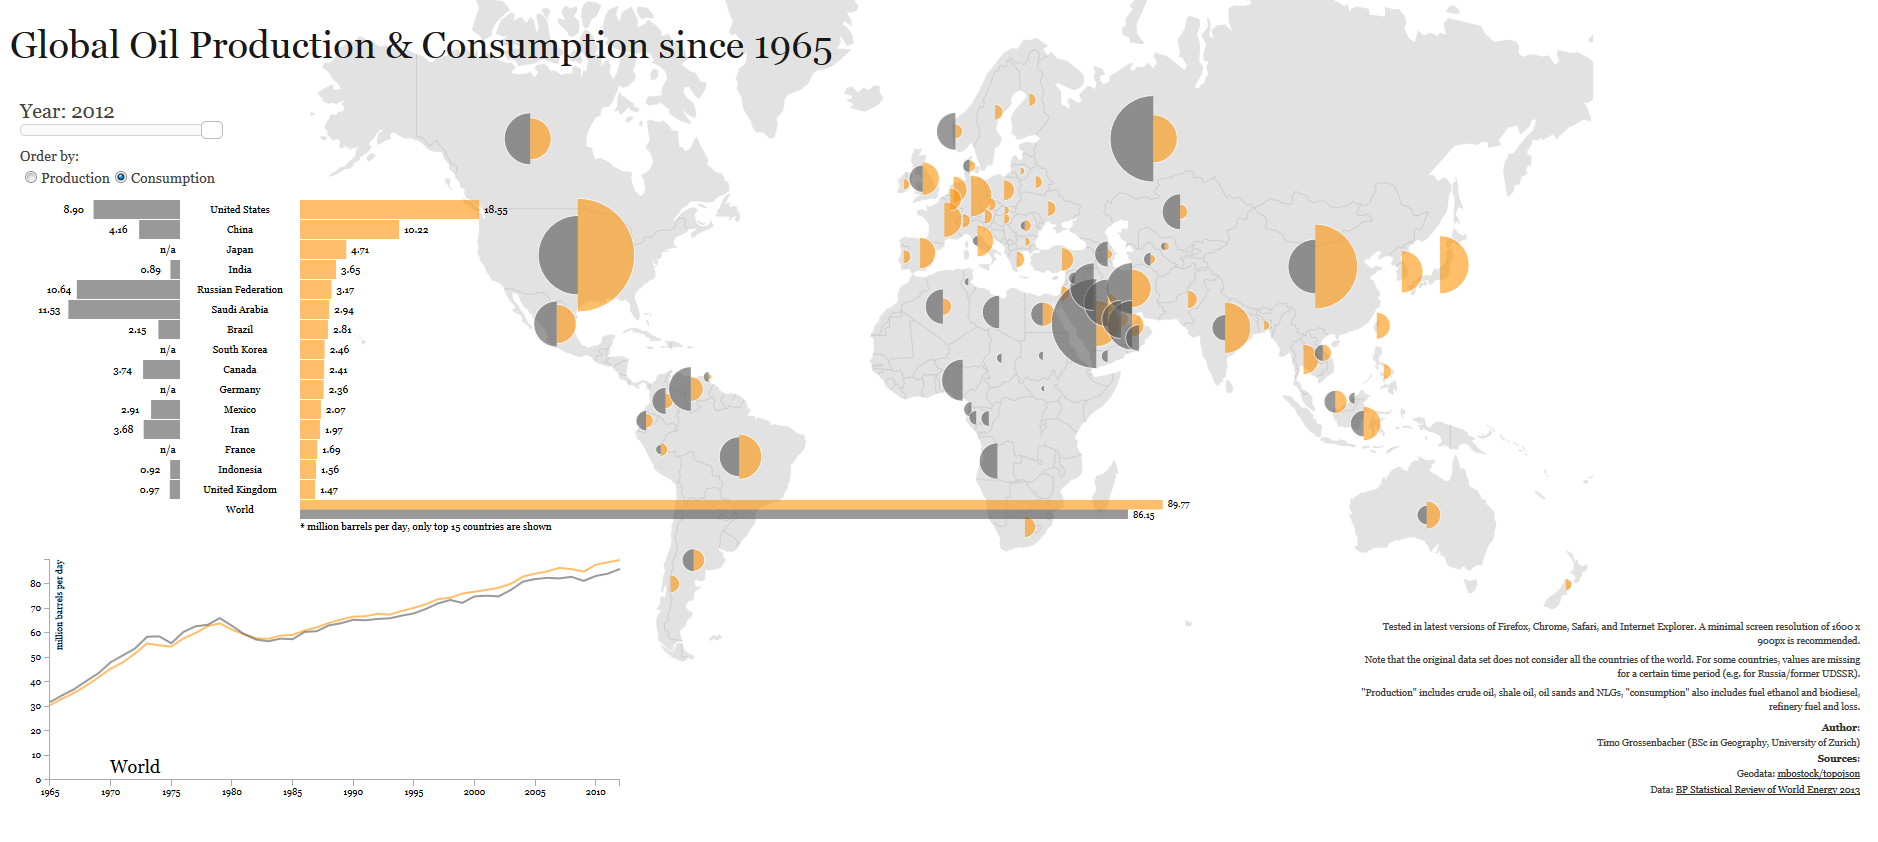
oil production and consumption since 1965When it comes to oil production and consumption, countries have a very close relationship of interdependence with each other. Some countries consume more oil than what they produce relying on imports to satisfy their internal demand. Others, consume less than what they produce, being able to export oil to nations that need it.

Oil consumption (yellow) for the United States, for example, was larger than its production (grey) for 2012, 18.55 mb/d (million barrels per day) compared to 8.9 mb/d, importing more than double its production to satisfy the gap in internal demand. Other nations with oil consumption higher that oil production include China, Brazil, Australia, India, UK, and Indonesia.

In contrast, oil consumption for Saudi Arabia for 2012 is estimated at 2.94 mb/d, while its production reached 11.53 md/d, exporting its oil surplus to the rest of the world. Other nations whose oil production exceeds its oil consumption include Canada, Mexico, Venezuela, Norway, Russia, Kuwait, United Arab Emirates, and Qatar.

Source: Winston Smith Labs: Global Oil Production and Consumption since 1965 [Interactive Map/Graph]
 

Key Commodities and Emerging Markets

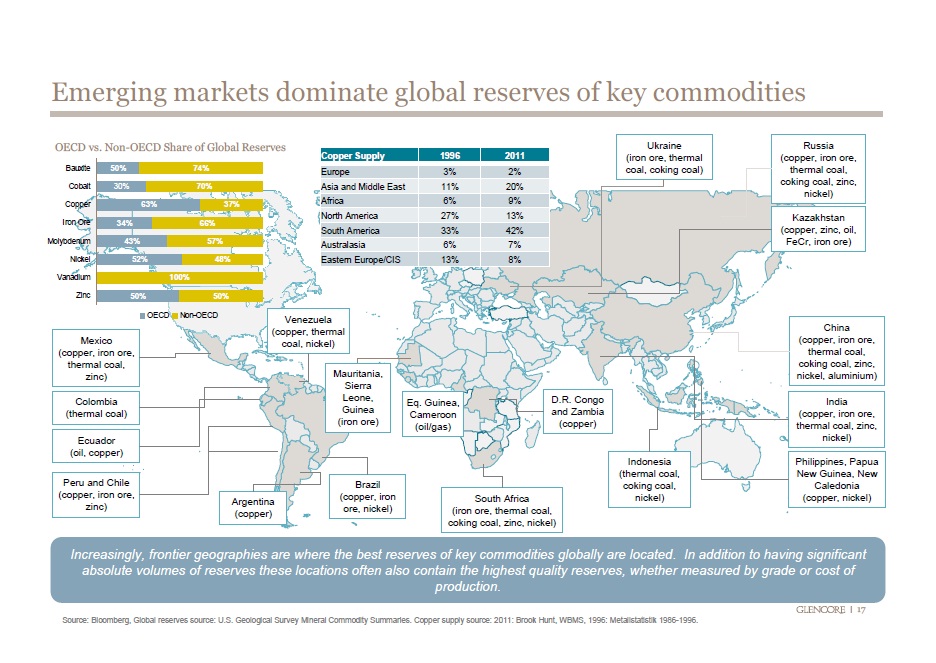
emerging market dominate commoditiesCommodities are raw materials essential for the production of more complex products. Commodities fall into three large categories: agricultural, energy, and metals.

According to this visualization, emerging economies (Brazil, Russia, India Indonesia, China, South Africa, etc.) have the largest reserves of certain key energy and metal commodities such as oil, coal, copper, cobalt, iron ore, molybdenum, nickel, zinc, and aluminum.

Source: Business Insider: 36 Maps That Explain The Entire World


The 50 Largest Ports in the World

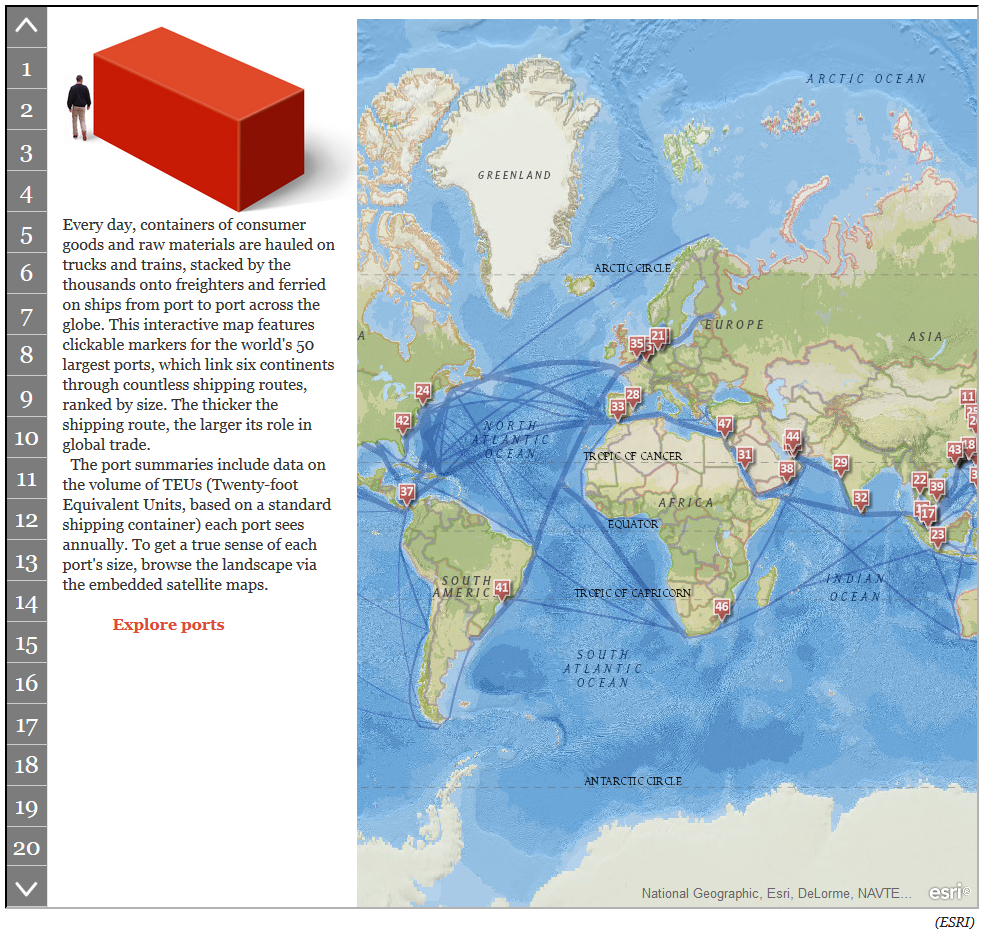
worlds 50 largest portsEvery day finished goods and commodities are transported  by sea in shipping containers from one port to another across the globe. Standard shipping containers measure 20 feet long by eight feet wide, hence they receive the name of “Twenty-foot Equivalent Units” or TEUs.

The largest port in the world is in Shanghai (China) which saw a volume of 31.74 million TEUs of cargo freight passing through its port in 2011. Shanghai is followed by Singapore (Singapore) which saw a volume of 29.94 million TEUs passing through its port for the same year. Singapore is followed by Hong Kong, Shenzhen (China), Busan (South Korea), Ningbo, Guangzhou, and Qingdao (China), Dubai Ports (United Arab Emirates), and Rotterdam (Netherlands), all in the top ten.

For the interactive map, that allows you to explore each one of the largest 50 ports in the world, visit: The Smithsonian: Interactive: The 50 Largest Ports in the World


Crude Oil Exports and Imports by Country

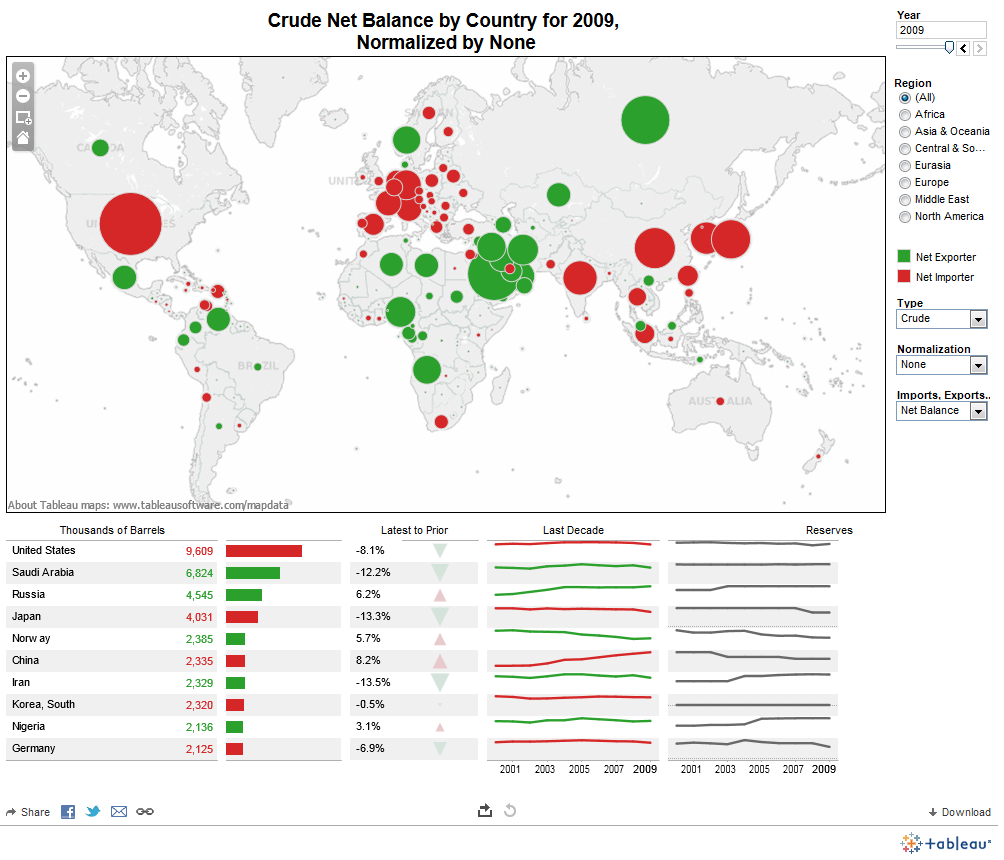
crude net balance by countryVast quantities of crude oil are exported and imported each year. Some countries are net exporters (their oil exports are larger than their oil imports), and some are net importers (their oil imports are larger than their exports).

In this visualization by Data Driven Consulting, we can see that the United States was the largest net importer of crude oil in 2009. Other net importer countries include China, India, Japan, South Korea, Germany, Belgium, Italy, UK, Spain, Singapore, and Australia.

Among the net exporters of crude oil we find Russia, Saudi Arabia, Iran, Iraq, Norway, Venezuela, Mexico, and Canada.

For the full-size interactive dashboard, visit: Tableau Public: Exporters and Importers


Food Exports and Imports Worldwide

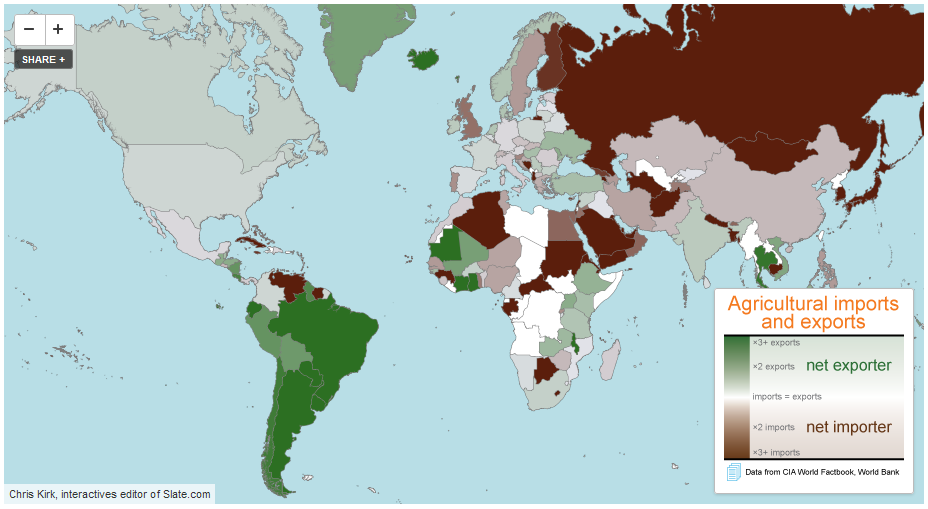
Some countries are net exporters of food (their food exports are larger than their food imports) while others are net importers of food (their food imports are larger than their food exports).

Among the net exporters of food we find the majority of South American countries, with the exception of Venezuela and Suriname, the United States, Canada, Mauritania, Indonesia, Australia, and a few African countries such as Mauritania, Ivory Coast and Ghana. The largest net exporter of food, by far, is Argentina with $23.42 of food exports per every $1.00 of food imports. Argentina is followed by Brazil, New Zealand, Paraguay and Iceland.

Among the net importers of food we find countries such as Russia, Finland, Sweden, the UK, Italy, Germany, Portugal, Sudan, Cuba, Saudi Arabia, Japan, etc. The largest net food importer is Eritrea, with $0.01 of food exports per every $1.00 of food imports. Eritrea is closely followed by Venezuela, Turkmenistan, and Algeria.

Data for for both agricultural exports and imports are for 2010.

Source: Slate.com: Maps: Agriculture in the U.S. and Around the World


Colombian Coal

We recently added Colombian coal to the list of commodities that we track in our commodities section. You can now analyze the average monthly price of Colombian coal for the past 30 years, as seen in the graph below.

Coal, Colombia - Monthly Price - Commodity Prices - Price Charts, Data, and News - IndexMundi

In addition to monthly price data, we also have production, consumption, exports, and imports of Colombian coal in terms of quantity, and value in dollars of Colombian coal exports and imports.

Will China Dominate the World Beer Market?

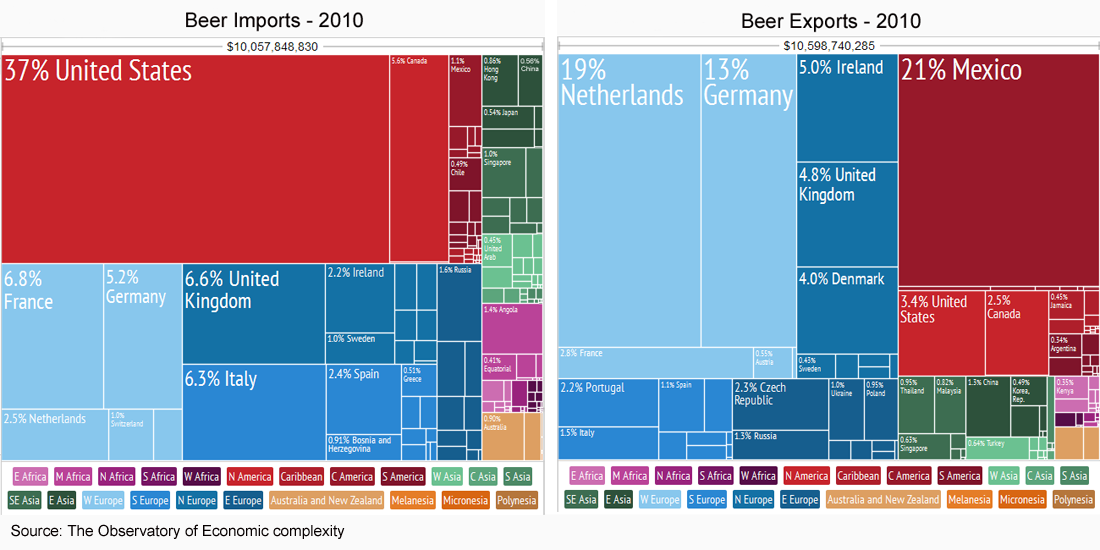
According to a report by the Kirin Institute of Food and Lifestyle, in 2010 China remained the largest consumer of beer for the eight consecutive year. China’s beer consumption increased 5.9% with respect to 2009, with a share of 24.5% of total world beer consumption.

In the world trade arena, though, China is still a small player. China’s imports of beer for 2010 amounted to only 0.56% of total world beer imports, way below the United States (37%), France (6.8%) and the UK (6.6%). China’s exports for the same year amounted to only 1.4% of total world beer exports, below Mexico (21%), the Netherlands(19%), Germany (13%), and the United States (3.4%) to name a few. However, because of the size of China’s economy, there is a huge potential for the world’s largest beer exporters to see China with a lot of optimism. Read more…