Tag Archives: Asia

The Failed States Index 2013

failed state index 2013Fund For Peace just released the Failed State Index (FSI) 2013. The FSI measures the level of risk in each country using a series of risk indicators such as mounting demographic pressures, massive movement of refugees, uneven economic development, poverty, legitimacy of the state, progressive deterioration of human services, violation of human rights, violation of the rule of law, security apparatus, intervention of external actors, etc. The FSI is calculated for a total of 178 countries.

Nations ranking at the top for failed states (red) include Somalia, Congo, Sudan, and South Sudan. Unfortunately, most of the world’s nations seem to be under a warning (orange) for failed states, from Africa to Asia to Latin America.

For the complete list of countries, rankings and scores, please visit: Fund For Peace: Failed State Index (FSI) 2013

 

World Population Growth Over Time

population growth over time 1800-2050

World population growth accelerated in the last century. During the twentieth century alone, the number of people increased from 1.5 billion to 6 billion.

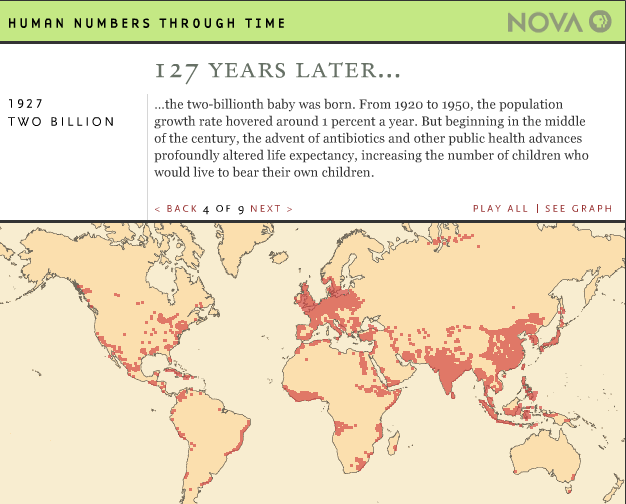
In the year 1800 the world’s population had reached 1 billion, with most people living in Asia and Europe. By 1927, 127 years later, the population of the world had doubled, reaching an staggering 2 billion people.

population growth over time 1927Population growth remained almost the same until 1950 when advances in science and medicine increased life expectancy, specially in developed nations.

The world’s population reached 3 billion inhabitants by 1960, 4 billion by 1974, 5 billion by 1987, 6 billion by 1999, 7 billion by 2011.

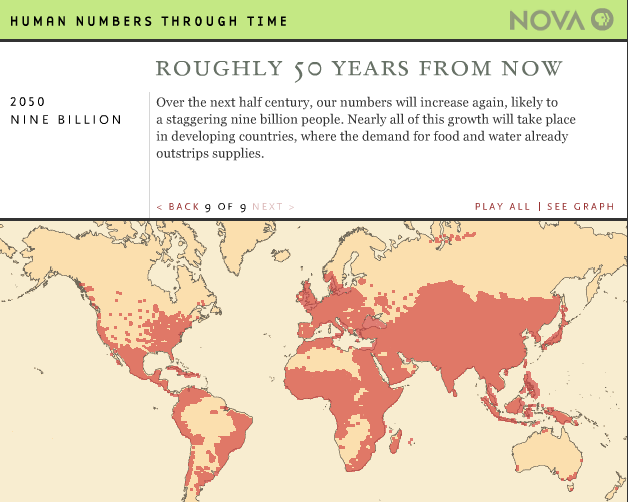
population growth over time 2050It is estimated that the population of the world will reach 8 billion by 2024, and 9 billion by 2050. Most of the growth will occur in developing nations

Source: NOVA: Human Numbers Through Time


Hunger Map 2012

mdg hunger map 2012One of the targets of the Millennium Development Goals (MDG) is to reduce the number of people with hunger by half by the year 2015. An estimated 870 million people still suffer from hunger around the world.

This map published by the Food and Agriculture Organization of the United Nations (FAO), shows that a good number of developing nations have made progress toward reaching that goal, as can be seen for the countries in green, with East Asia and Latin America as the top performers. On the other hand, many countries in Africa and West Asia have not made any progress, or worse, their situation has even deteriorated as can be seen for the countries in yellow or red.


The Influenza Virus Visualized

Humans can be infected by influenza viruses types A,B, and C. Type A affects humans, birds, and pigs. Type B and C affect only humans. Type C is less severe than type A and it does not cause pandemics.

In this visualization by Information is Beautiful, we can see how the different strains of influenza virus affect humans, what is their origin, and how they are transmitted from pigs and from birds ultimately to humans.

Type A influenza is divided into H and N strains. The “swine flu” N1H1 killed 15,000 people worldwide in 2009-2010. The “bird flu” H5N1 strain, with a fatality rate of 60%, has killed 371 people as of 2013. The more recent H7N9 strain has killed thousand of pigs in China, with 8 human fatalities to date.