Tag Archives: cars

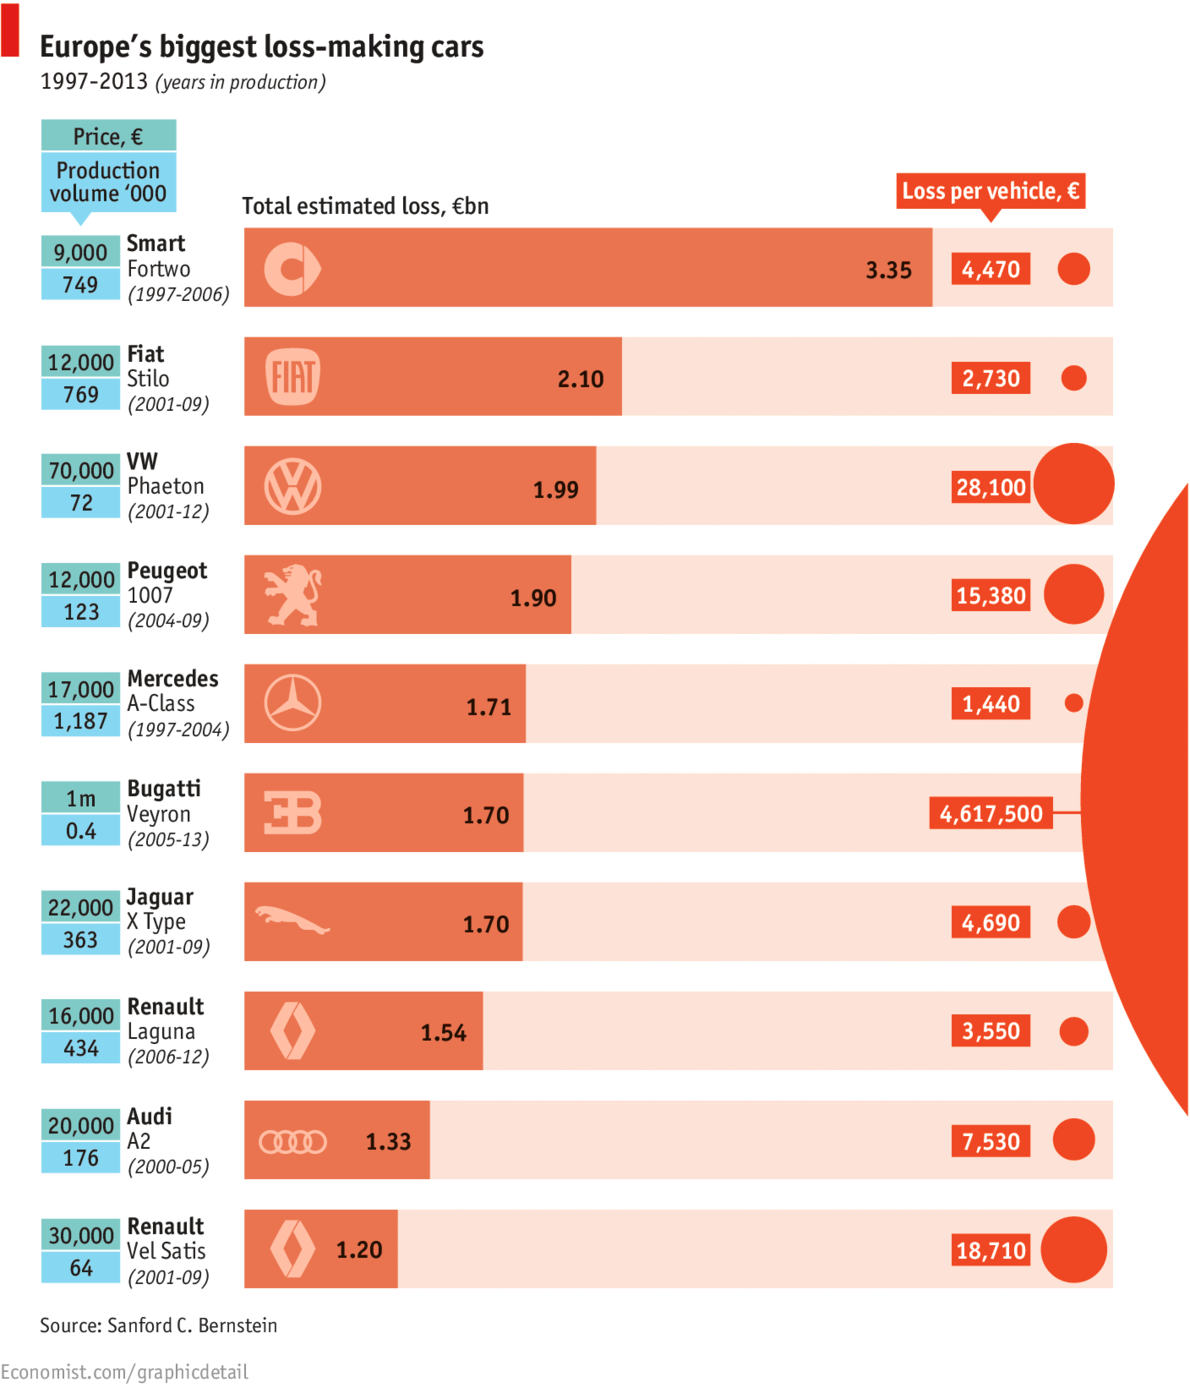
Europe’s Loss-Making Cars

europe biggest loss-making cars 2013

European car makers are having a hard time with some of their models, which have generated big losses for the industry in the region. Here is a chart that shows European car manufacturers, their respective loss-making models, and how much money they lost per model.

Source: The Economist: Zoom, sputter, aagghhh!! – The biggest loss-making cars in Europe


Gasoline Spending by State in the U.S.

gas guzzlers mint finalMint.com tracked how much its users spend on gasoline in one month, and how many times they visit the pump in the same period across the United States.

On average, Americans spend $177 on gas in single month, making an average of 6 visits to the pump, and spending an average of $32 in each transaction.

San Jose (California) stands out as the city where Mint users spend the most on gas, an average of $216 in a single month. Other cities where Mint users spend a lot on gas include Birmingham (Alabama), Jacksonville (Florida), Phoenix (Arizona), and Charlotte (North Carolina) to name a few. In contrast, in cities like New York, Brooklyn (New York), and Washington D.C., which have a good public transportation system, the gas bill is between $102 and $112 per month.

Source: Mint: Gas Guzzlers
 

Ways of Transportation in Six Selected Cities

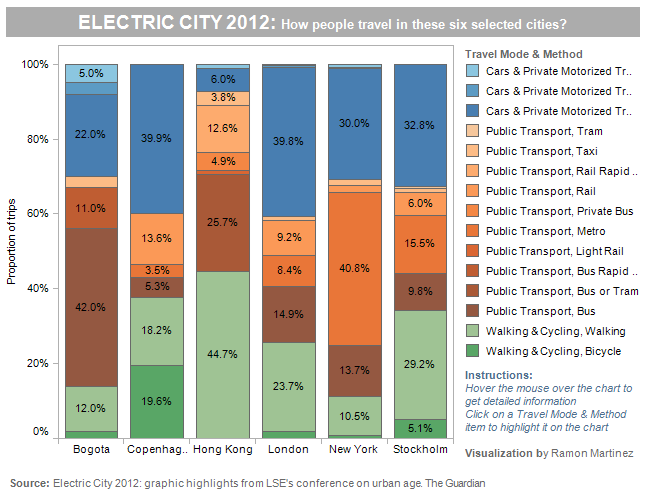
Interesting transportation patterns emerged from the 2012 LSE Cities conference, which focused in the way cities across the globe adjust to technological innovation and environmental changes.

The graph above displays transportation patterns for six selected cities: Bogota, Copenhagen, Hong Kong, London, New York, and Stockholm. Of the six selected cities, Hong Kong is where walking and biking are the most common ways of transportation, a good 44.7%, and where cars and other private motorized vehicles are used the least (7.2%). Copenhagen and London, are the cities where the most common way of transportation are cars and other private motorized vehicles (39.9% and 39.8% percent respectively). New York city and Bogota are the cities where public transportation is most commonly used (57.9% and 56% respectively). In Stockholm, all three ways of transportation (walking/biking, private cars, and public transportation) are used almost in similar proportion.

For more detailed information visit:


Traffic Deaths by Country

Traffic deaths by country

Traffic deaths per 100K people

Approximately 1.3 million people die each year on the world’s roads, according to the 2009 Global Status Report on Road Safety published by the World Health Organization (WHO). Using data from the report, we created the two maps shown above. The first map shows the total number of road traffic deaths by country. The map shows that India (105 thousand) and China (96 thousand) have the highest number of road traffic deaths, which is not surprising given their large populations and large number of registered vehicles. It is worth noting though that while there were approximately 145 million registered vehicles in China in 2009, the total for India was only 72 million. In other words, India had a much higher rate of road traffic deaths per registered vehicle than China.

The second map shows the number of road traffic deaths per 100,000 inhabitants. The largest rates of road traffic deaths occur in Eritrea (48.4), Egypt (41.6), and Libya (40.5). The map also shows that relatively high rates of road traffic deaths occur in many countries in Africa and the Middle East.