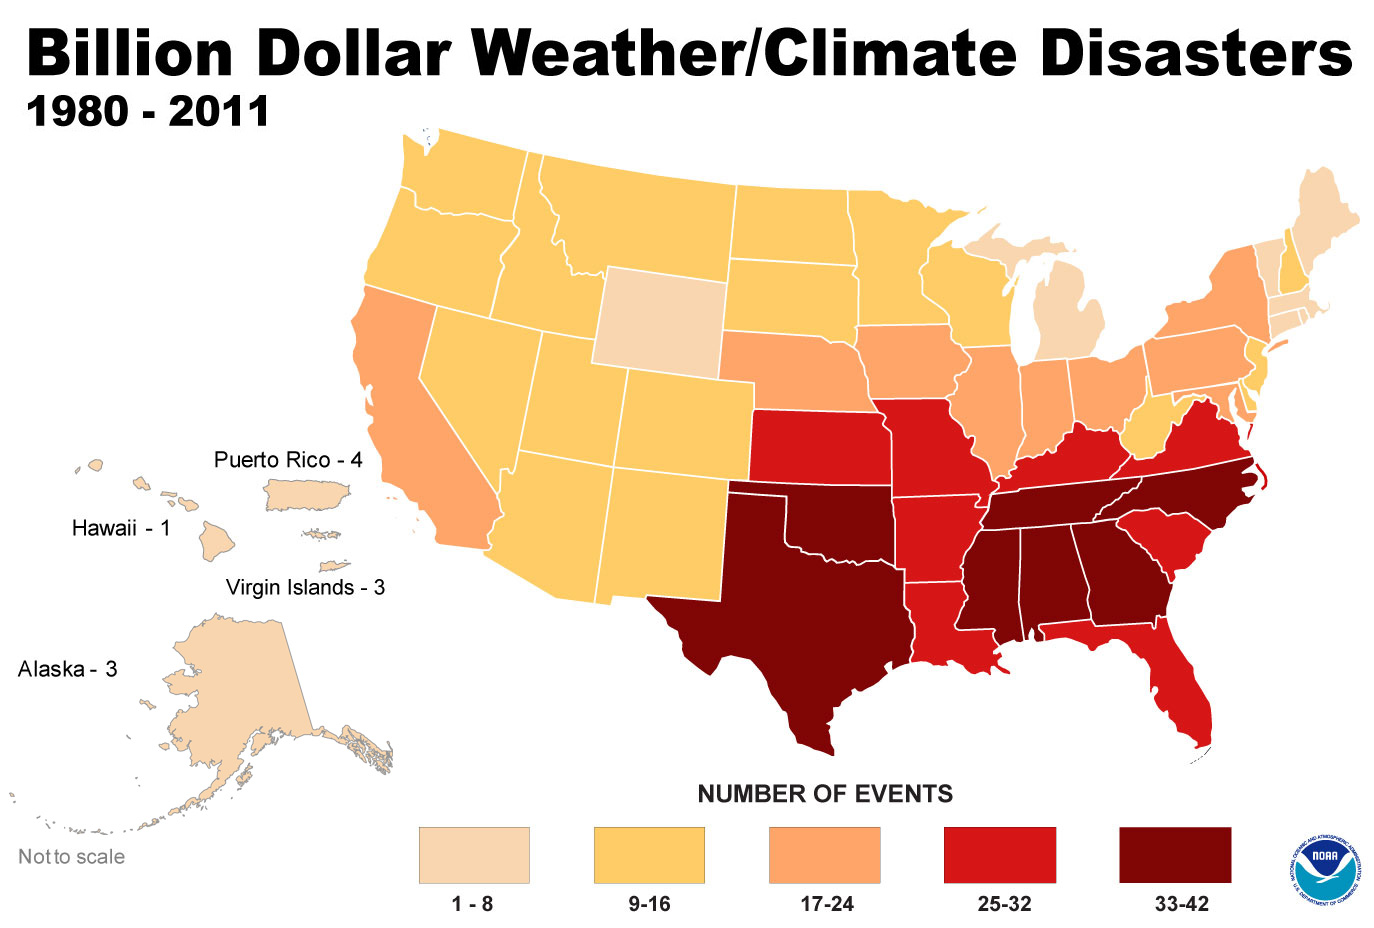
As the economic damage from Hurricane Sandy is still being evaluated, we took a look at the damage from weather/climate-related disasters over the past 30 years. The National Climatic Data Center (NCDC) at the National Oceanic and Atmospheric Administration keeps detailed statistics of all weather disasters in the US. One of the visualizations the NCDC has created is a thematic map of billion-dollar weather events, which can be seen above. The map shows the number of events that caused at least a billion dollars in damage by state. Southern states suffered the most damage up until 2011. The colors in the map may look significantly different once the total tally of Sandy is calculated.
