Tag Archives: environment

Drought Severity by Country (1901 – 2008)

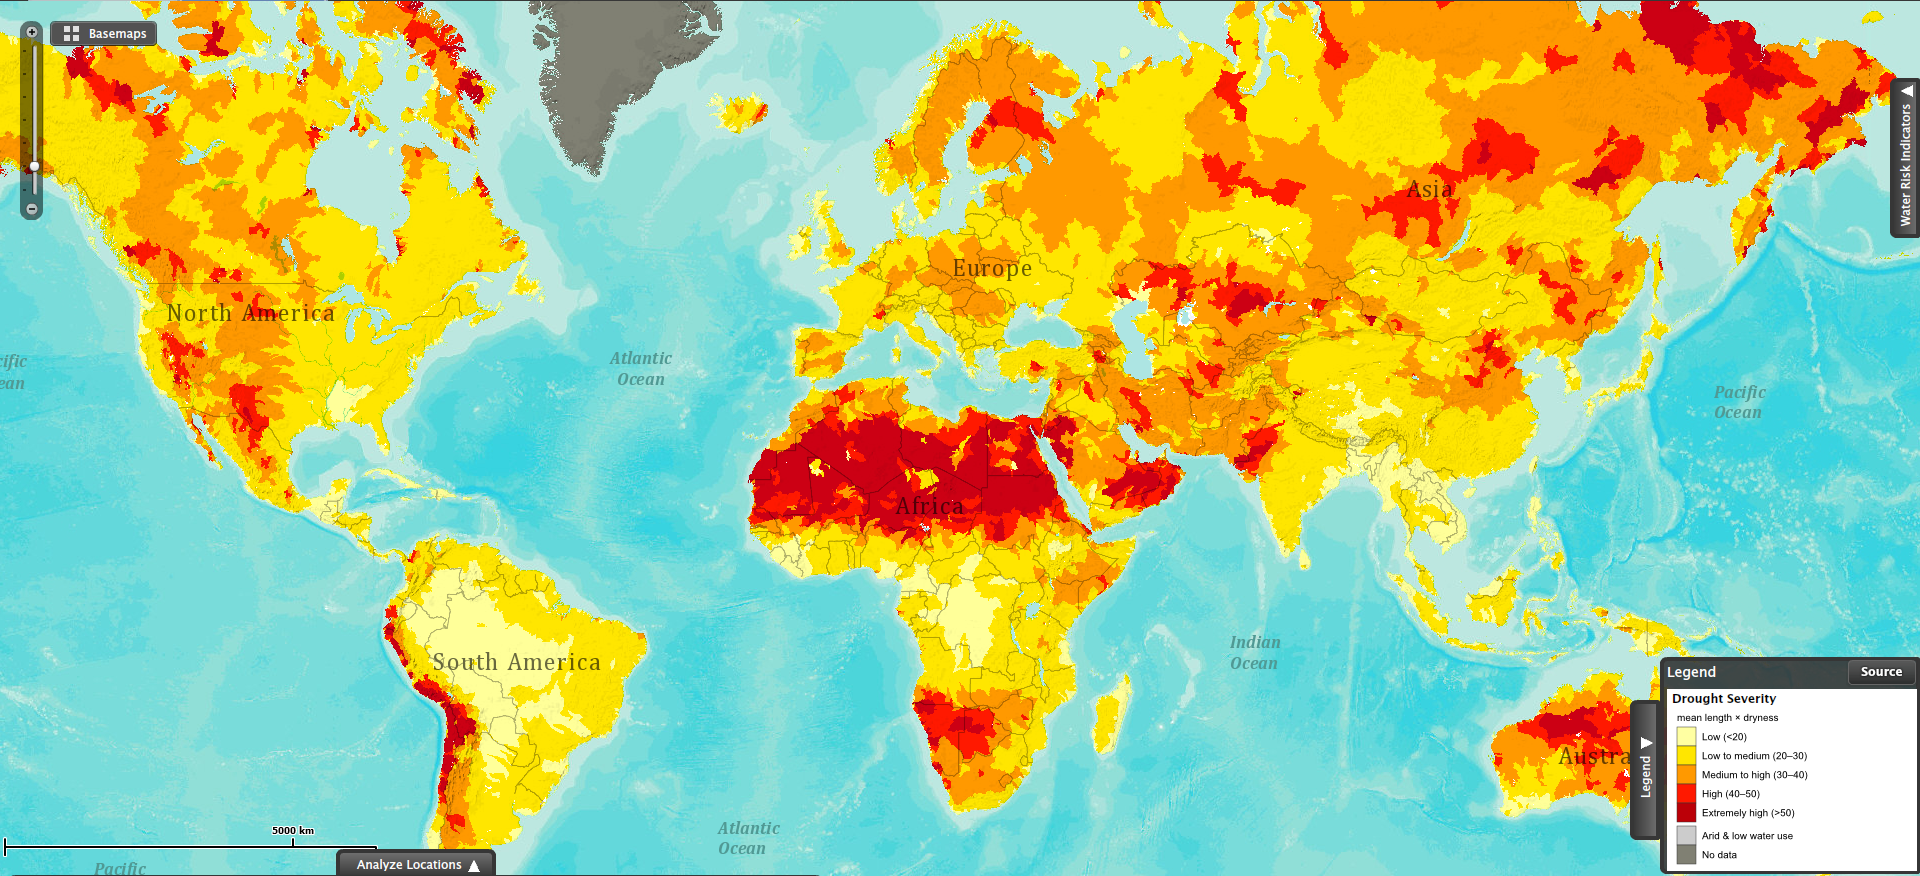
drought severity worldThis map shows drought severity, measured as the product of the average length of a drought occurrence and how dry it was the drought. This visualization is based on data collected for the period between 1901 and 2008.

The red areas in the map show the regions most severely affected by droughts. The northern region of the African continent stands out as the largest area being affected by severe droughts. Southwestern Africa (Namibia and Botswana) has also been severely affected by droughts in the same period.

Some areas in the Andean region in South America (Ecuador, Peru, Bolivia, Chile and Argentina) have also suffered the effects of severe droughts during the past century.

Parts of Australia and Russia have also been affected by extreme drought conditions.

Sources:


Total Carbon Emissions by Country

The Kyoto Protocol is an international treaty that seeks the reduction of greenhouse gases that contribute to global warming by setting emission reduction targets for industrialized nations. The Kyoto Protocol was signed on December 11, 1997 in Kyoto (Japan) by 191 countries. The United Stated signed the treaty, but later it did not ratify it.

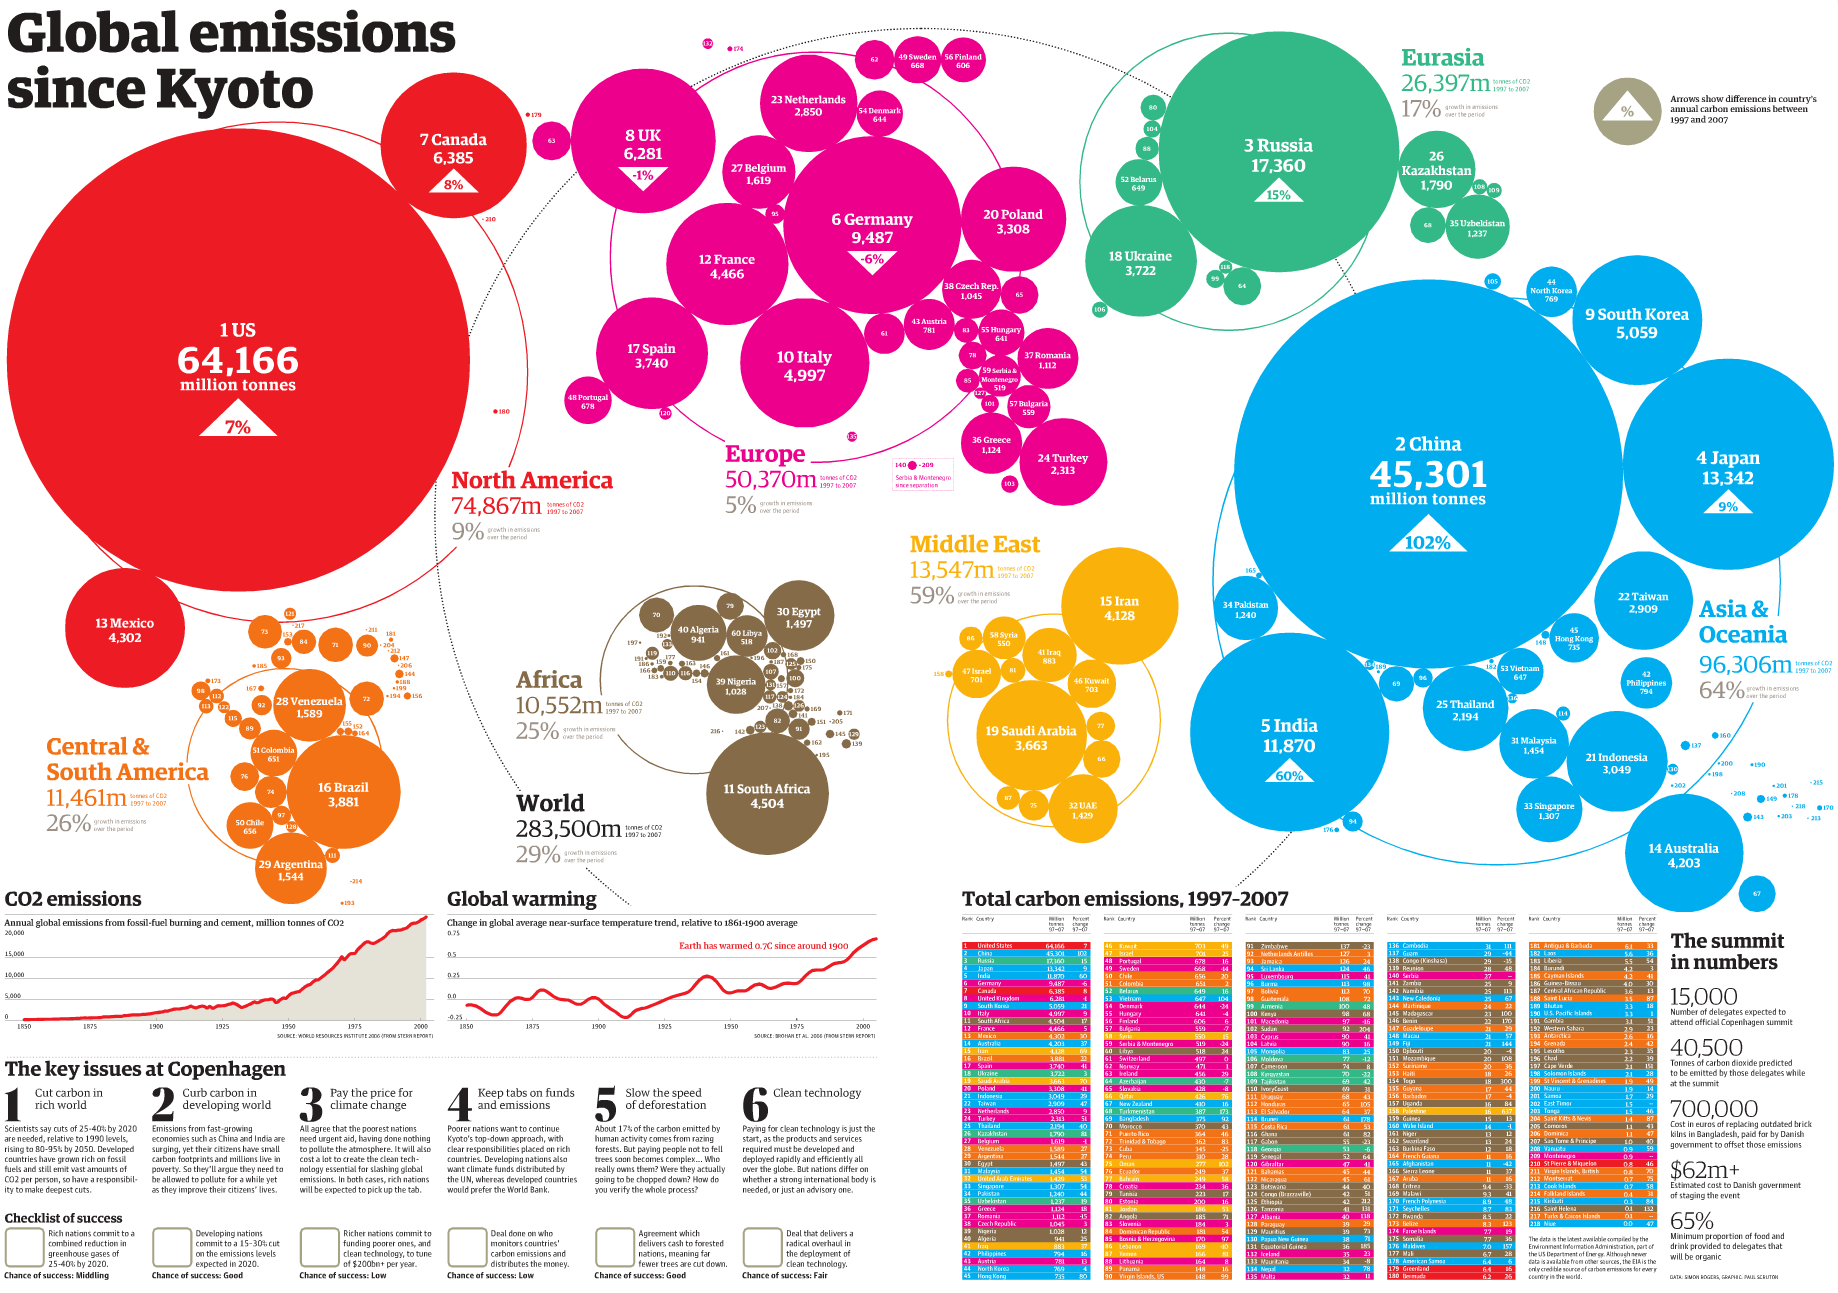
This visualization by The Guardian shows total carbon emissions by country between 1997 and 2007, ten years since the protocol was signed.

The United States is the country that has produced the largest amount of carbon emissions (64,166 million tonnes) in the period 1997-2007 followed by China, Russia, Japan, India, and Germany.

Asia and Oceania combined are the regions with the highest carbon emissions produced in the same period (96,306 million tonnes). Asia and Oceania are followed by North America (U.S., Canada, and Mexico) with carbon emissions of the order of 74,867 million tonnes, and Europe with carbon emissions at 50,370 million tonnes as of 2007.


Forest Areas as a Percentage of Land Area Worldwide

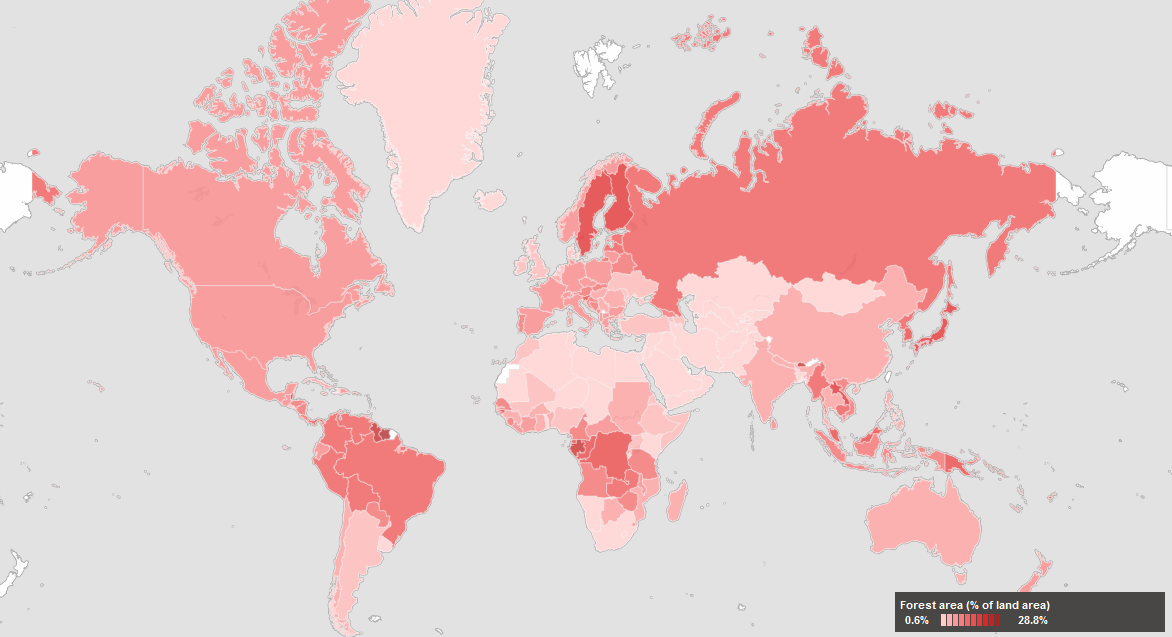
March 21, 2013 has been declared the first International Forest Day by the United Nations. In that light, we decided to take a look at one key environmental indicator that measures the percentage of forest area present in different regions of the planet.

The map above, created by the World Bank depicts forest areas as a percentage of land area for each country. Forest area is defined as land, natural or planted, under groves of trees of at least 5 meters (productive or not), excluding tree groves in agricultural production systems.

Countries with the highest forest area as a percentage of land area (dark red areas) include: Guyana, Suriname, and Belize in the Americas; Finland and Sweden in Europe; Bhutan, Laos, Japan, South and North Korea in Asia; Guinea, Gabon, Democratic Republic of Congo, Congo, and Guinea Bissau in Africa; Papua New Guinea in Oceania.


Fossil Fuel Subsidies Globally

Fossil fuel subsidies are very common in developing nations. Subsidies cover the difference between the price at which fossil fuels are sold inside the country and their actual price in international markets, creating a huge fiscal burden (an estimated $400 billion annually) for the countries that provide them. Developing nations with fossil fuel subsidies include: Venezuela, Argentina, Ecuador, Algeria, Libya, Egypt, Kuwait, Iran, Pakistan, Russia, China, India, Indonesia, etc.

Developed nations also provide subsidies in the form of tax breaks to the oil industry and other measures (estimated at a cost of $45 to $75 billion per year). Nations in this group include many OECD (Organization for Economic Co-operation and Development) members.

For the interactive map, visit: National Geographic: The Great Energy Challenge: Fossil Fuel Burden on State Coffers


Ways of Transportation in Six Selected Cities

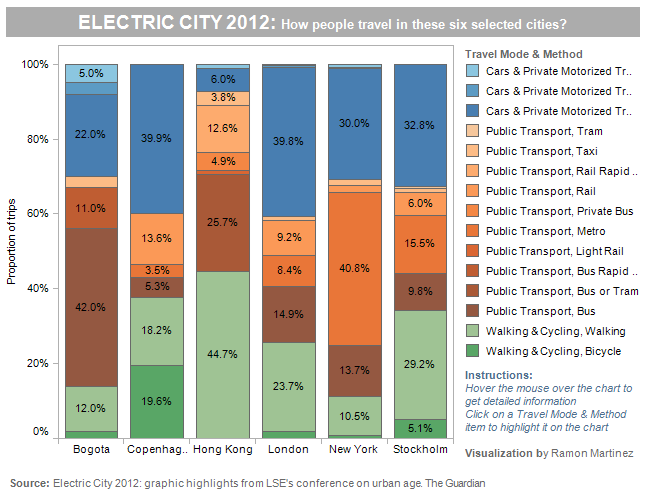
Interesting transportation patterns emerged from the 2012 LSE Cities conference, which focused in the way cities across the globe adjust to technological innovation and environmental changes.

The graph above displays transportation patterns for six selected cities: Bogota, Copenhagen, Hong Kong, London, New York, and Stockholm. Of the six selected cities, Hong Kong is where walking and biking are the most common ways of transportation, a good 44.7%, and where cars and other private motorized vehicles are used the least (7.2%). Copenhagen and London, are the cities where the most common way of transportation are cars and other private motorized vehicles (39.9% and 39.8% percent respectively). New York city and Bogota are the cities where public transportation is most commonly used (57.9% and 56% respectively). In Stockholm, all three ways of transportation (walking/biking, private cars, and public transportation) are used almost in similar proportion.

For more detailed information visit:


The Top 10 Challenges for India

India is a country with extraordinary problems due to the size of its population. At the same time, it has extraordinary potential which may be realized if it can implement some major changes best identified in a paper released by Goldman Sachs in 2008 (PDF). According to the study, there are ten key areas where reform is needed:

  1. Improve governance
  2. Raise educational achievement
  3. Increase quality and quantity of universities
  4. Control inflation
  5. Introduce a credible fiscal policy
  6. Liberalize financial markets
  7. Increase trade with neighbors
  8. Increase agricultural productivity
  9. Improve infrastructure
  10. Improve environmental quality

I believe the only controversial item in the list above may be number six, given the disastrous effects that financial market deregulation had in the US in recent years. Nevertheless, the nine other recommendations are still highly relevant and fundamentally sound. Do you agree?

Interesting Links of the Day – June 22, 2012

  1. Rio+20 Earth summit on 20 June – in pictures (The Guardian)
  2. Rio+20: Development banks to invest $175 billion in sustainable transport (United Nations Conference on Sustainable Development 2012)
  3. Rio+20: protecting the environment is not enough – Antonio Patriota (The Guardian)
  4. The greening (?) of agriculture in Latin America – John Nash (World Bank)