Tag Archives: India

The Global Public Debt Clock is Ticking

click to enlarge

Global public debt is increasing every second. This debt clock shows government debt, in dollar terms, for almost all countries. Governments with the highest debt include the United States, Canada, Brazil, Australia, India, China, and several western European nations.

Additional indicators such as public debt per person, public debt as percentage of GDP, total annual debt change, and country debt comparisons can be seen in the interactive map at: The Economist: The global debt clock

 

Terrorism Around the World

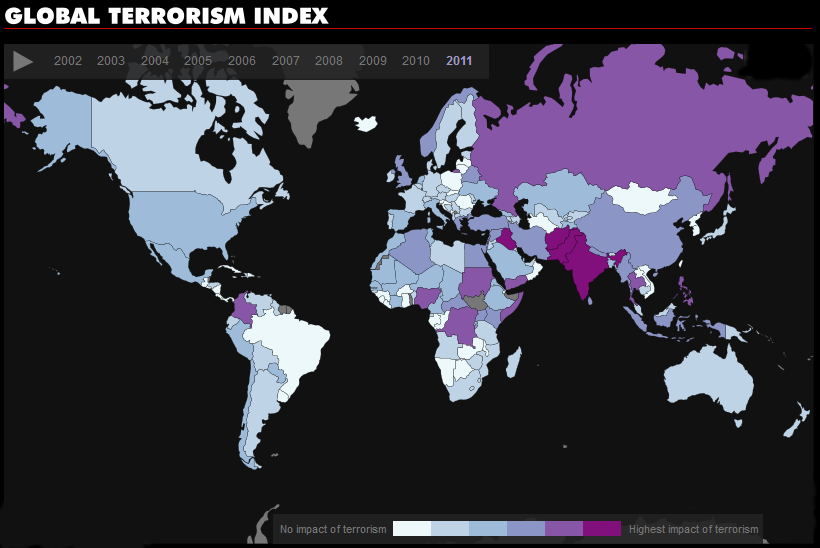
The Global Terrorism Index (GTI) ranks 158 countries based on the impact of terrorism in each of these countries. The rankings goes from 1 to 10, 1 being the lowest impact of terrorism and 10 the highest impact of terrorism. For 2011, the countries ranked at the top are Iraq, Pakistan, Afghanistan and India, followed by Yemen, Somalia, Nigeria, Thailand, Russia, the Philippines, Sudan, the Democratic Republic of Congo, Colombia and Syria.

The GTI uses four indicators to measure the impact of terrorism: number of incidents, number of deaths, injuries and property damage. A five year weighted average is also used in order to measure the lasting impact of terrorism in a particular country.

For more details see: Vision of Humanity – Global Terrorism Index


Migrant Remittances Continue to Rise

click to enlarge

click to enlarge

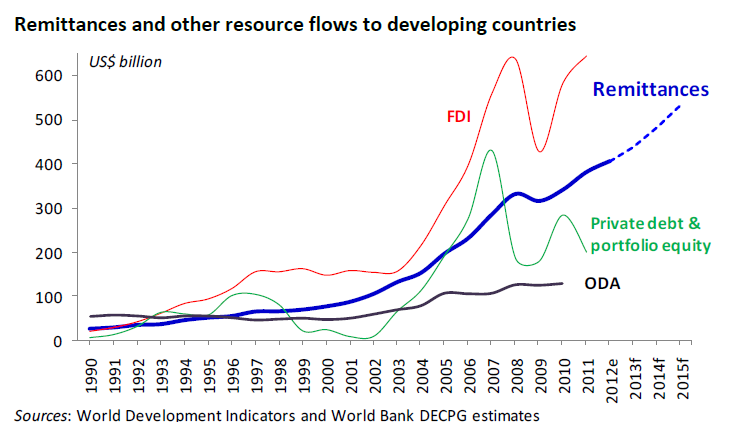
Migrant remittances to developing countries are expected to reach $406 billion in 2012, a 6.5 percent increase over the previous year, and $534 billion in 2015. These officially recorded remittances have kept increasing despite high remittance costs and the financial crisis. This source of income for developing economies constitutes more than three times the size of Official Development Assistance (ODA).

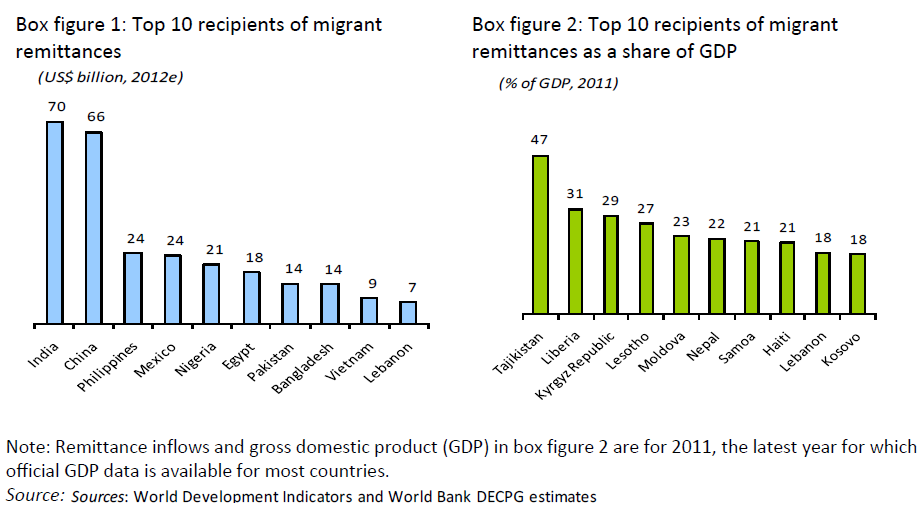
The highest recipients of migrant remittances among developing economies for 2012 are India, China, the Philippines and Mexico. As a percentage of GDP, the highest recipients in 2011 were Tajikistan, Liberia, the Kyrgyz Republic and Lesotho.

Resources:


Life Expectancy vs. Fertility Rates Worldwide 1960-2010

click to enlarge

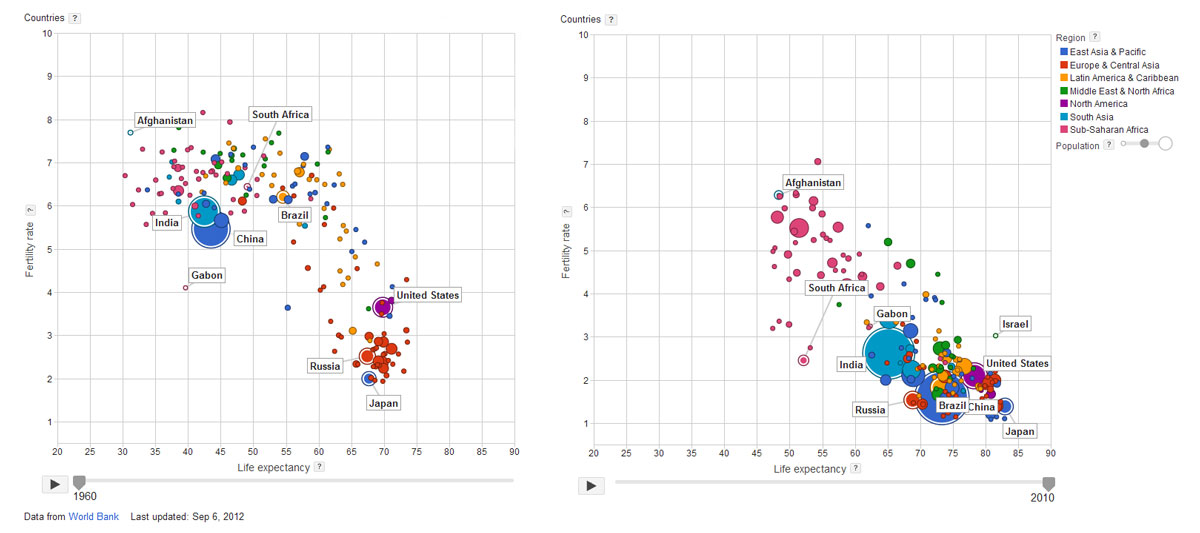
During the last fifty years, we have seen the gradual increase in life expectancy and the corresponding decrease in fertility rates worldwide. This is clearly the case of countries like China, India, the United States, Brazil, Japan, and Gabon, where dramatic improvements can be seen. On the other hand, countries like Russia, South Africa and Afghanistan, show moderate improvement.

It is very interesting to note, that although they have improved, a large cluster of African countries remain far from the overall trend, with lower life expectancy rates and higher fertility rates. For more information, check Google’s interactive bubble chart based on World Bank data.


Power Blackout in India Enters Second Day

  1. Electricity Transmission and Distribution in India: A report – World Energy Council
  2. 600 million without power in India after 3 power grids fail – Associated Press (USA Today)
  3. Power supply in eastern states hit by grid collapse (One India News)
  4. Blackout: India’s Mounting Power Crisis Enters Second Day – Palash R. Ghosh (International Business Times)
  5. India Endures World’s Largest Blackout – Sruthi Gottipati (New York Times)


Raw Sugar Prices Increase

Raw sugar prices are on the rise on fears that world demand will exceed global supply. According to Bloomberg, damaged sugar crops due to a drought in Russia and adverse weather conditions in Brazil and China are responsible for a supply shortage. Sugar - Monthly Price - Commodity Prices

Brazil, India, China, Thailand, Pakistan, Mexico, Colombia, Australia and the United States are the world’s largest sugar producers. Brazil dominates sugar world markets thanks to high demand for sugar-based ethanol.

High Cotton Prices

Cotton prices are expected to keep climbing. Excess demand over supply is the main factor. World supply is not likely to catch up soon since cotton inventories are currently low. Cotton crops in China and India have been damaged due to bad weather, and floods in Pakistan have further decreased cotton output. The major cotton producers are India, China, Pakistan, Uzbekistan and the United States.

As of January 2010 the price of cotton was at 77.4 cents per pound. By October 2010 the price of cotton had climbed to 126.55 cents per pound, an increase of 63.5%. The world cotton market is valued at approximately 12 billion annually.

Cotton - Monthly Price - Commodity Prices