Tag Archives: Japan

Most Visited Website per Country

most visited website per country

Google, Facebook, and Chinese search engine Baidu are the top three most visited websites in the world.

Using freely available website traffic statistics from Alexa, the authors of the map above found that most people in North America, Europe, South East Asia, and Oceania prefer Google. Due to the large number of Internet users in China and South Korea combined, an estimated one billion users, Baidu is the most visited website behind Google. Facebook comes in third with an estimated 280 million users spread from Latin America to the Middle East.

Source: Information Geographies: Age of Internet Empires


The Higher Cost of Higher Education

higher-education-international-studentsStudying abroad can be very expensive, specially if you are looking at universities in Australia or the United States.

The average cost of higher education for international students is very high in Australia, where a student is expected to pay a total of $38,516 in annual fees and cost of living. Australia is followed by the U.S. where the average cost of one year of higher education is estimated at $35,705. Other countries with a steep tab on higher education include the United Kingdom, Canada, Japan, Singapore, and Hong Kong.

On the other hand, more affordable higher education can be found in Germany, where the average cost of one year of college annual fees plus cost of living is estimated at $6,285. Other countries with affordable higher education include Spain, Taiwan, China, and Russia.

Source: International Business Times- International Students: Higher Education Is Really Inexpensive In Germany, But Not In The US [CHARTS]


Deaths by Hepatitis vs. Deaths by HIV by Country

hepatitis and hiv world HIV killed 1.47 million people in 2010. Viral hepatitis killed as many as 1.44 million people in the same year. Even though the number of deaths caused by viral hepatitis follows close that of HIV, its impact goes largely ignored worldwide.

According to The Economist, viral hepatitis killed more people in 117 out of 187 countries, including China, India, Japan, and the UK. In the map above, countries in dark red show a higher ratio of deaths by viral hepatitis to deaths caused by HIV. Those countries include Egypt, Mongolia, UK, Turkey, Yemen, Iraq, South and North Korea, Japan, Finland, Sweden, Poland, and Germany.

Source: The Economist: The other killer – Hepatitis kills more people than HIV in most countries


The Most and Least Ethnically Diverse Countries

diversity map harvardUsing data from the Harvard Institute for Economic Research, The Washington Post created this map that shows how ethnically diverse is a country.

Dark green countries are the more ethnically diverse. Such is the case of Canada, Mexico, several South American countries, including Peru, Bolivia, and Ecuador. The most ethnically diverse countries are located in Africa. In contrast, dark orange countries are more ethnically homogenous. That is the case of most European nations, China, Japan, South and North Korea, and Australia.


China at the Top of Renewable Energy Investment

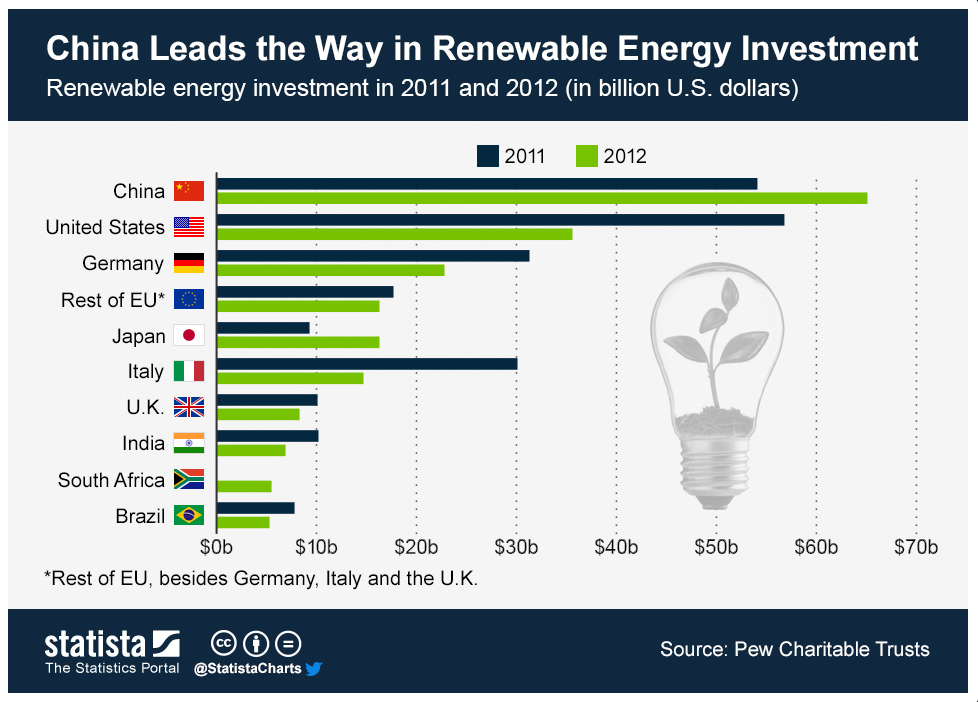
china leads energy investmentIn 2012 China’s investment in renewable energy surpassed the investment by the United States for the previous year and for the same year. In fact, China’s is ahead every other nation including Germany, Japan, and Italy.

China’s investment in renewable energy exceeded $60 billion for 2012, compared to an estimated $36 billion in the United States, and $23 billion in Germany for the same year.

Source: Statista: China Leads the Way in Renewable Energy Investment


U.S. Mobile Phone Subscribers Talk the Most

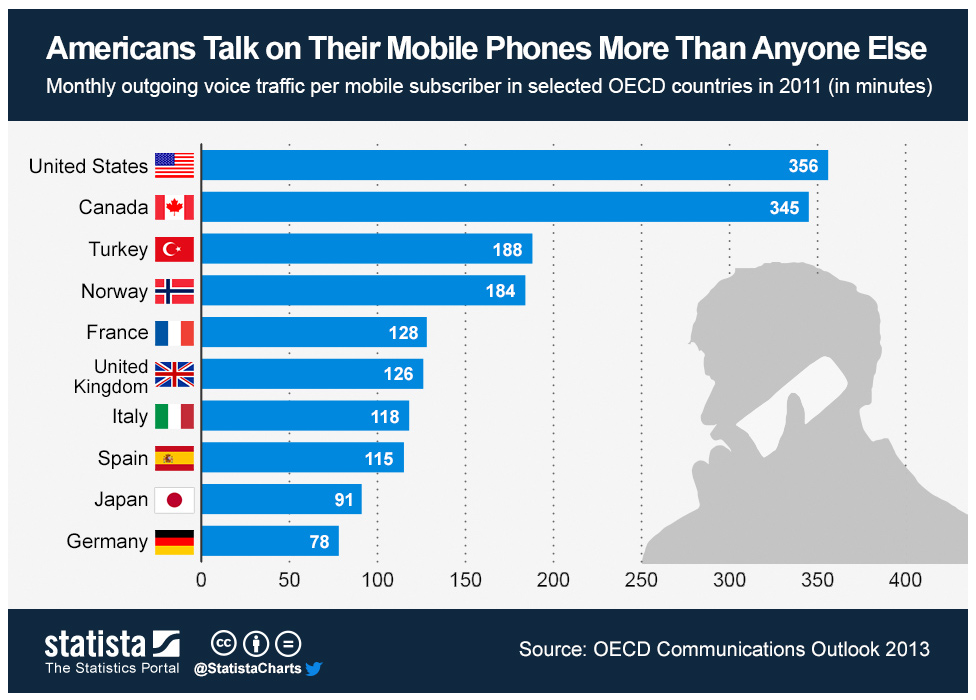
americans and the mobile phoneOn average, U.S. mobile subscribers talk on the phone 356 minutes, or roughly 6 hours per month. That number is double that of the Turkey, and 4.5 times that of Germany. That estimate is the highest among selected OECD countries.

Canadians are not far behind. The outgoing traffic per mobile subscriber is an average 345 minutes (5 hours and 45 minutes) in a single month.

 Source: Statista: Americans Talk on Their Mobile Phones More Than Anyone Else


Global Carbon Footprint by Country

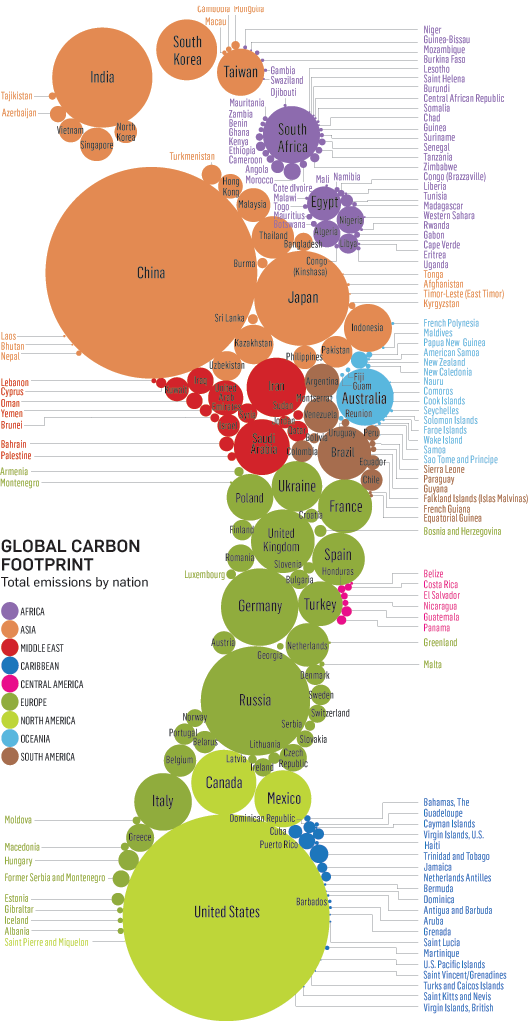
carbon footprint by countryThis original visualization by Stanford Kay shows total carbon emissions by country. Using different colors to differentiate each region, the size of the circle depicts the carbon footprint of each country.

Countries with the largest carbon footprint include China, United States, Russia, India, Japan, Germany, South Korea, Australia, UK, Iran, Saudi Arabia, Brazil, Taiwan, Ukraine, France, and Spain.


Wealth Comparison for the Years 1500 and 2015

wealth year 1500

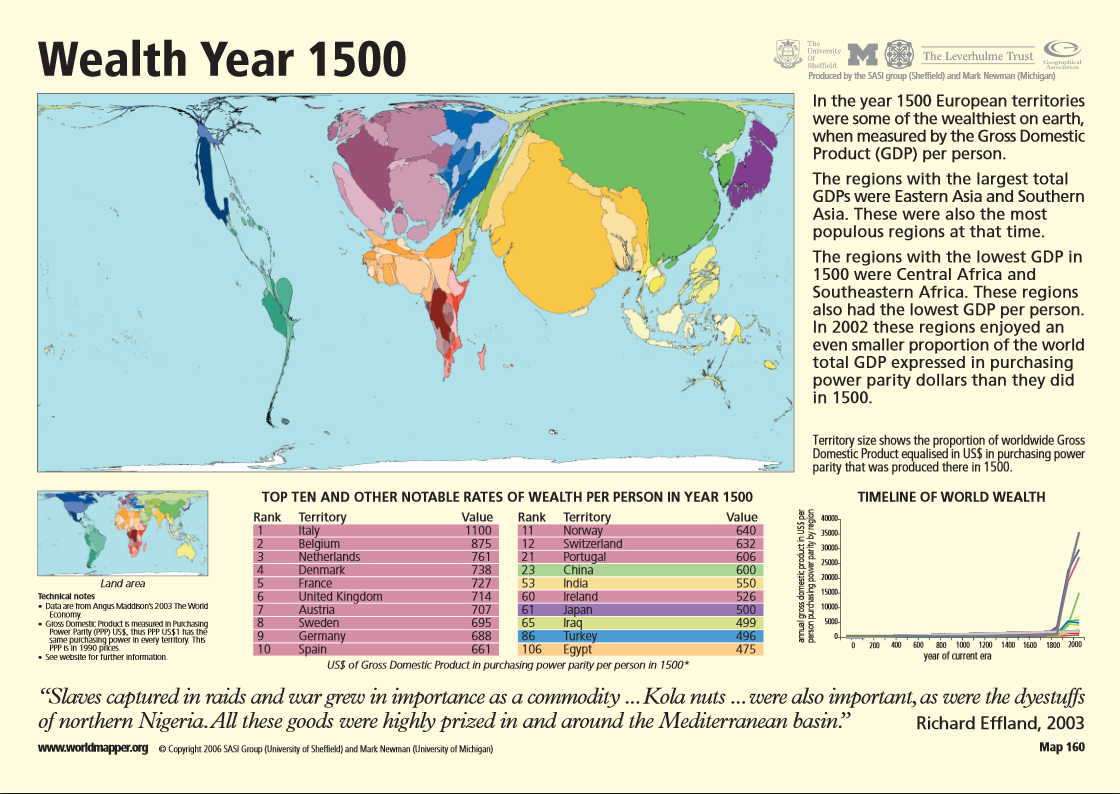
wealth year 2015Comparing the levels of wealth per person for the years 1500 and 2015, as shown in these two maps, it is interesting to see how economic power has shifted from some nations to others.

Back in the 1500s, economic power was held by a majority of European nations leaded by Italy. China ranked number 23, India 53, and Japan 61. North America’s wealth was negligible compared to Europe’s, but the African region enjoyed more wealth than they do today.

A forecast for the year 2015 places Taiwan, Hong Kong, and Singapore at the top in GDP per capita. Some European nations are still wealthy, such is the case of Malta, Luxembourg, Norway, and Ireland, but Italy is not in the lead anymore. Japan’s wealth per capita has increased, and so has the United States’, but the wealth of African countries has become the lowest worldwide.

Source: Global Finance: Wealth Distribution and Income Inequality by Country


Crude Oil Exports and Imports by Country

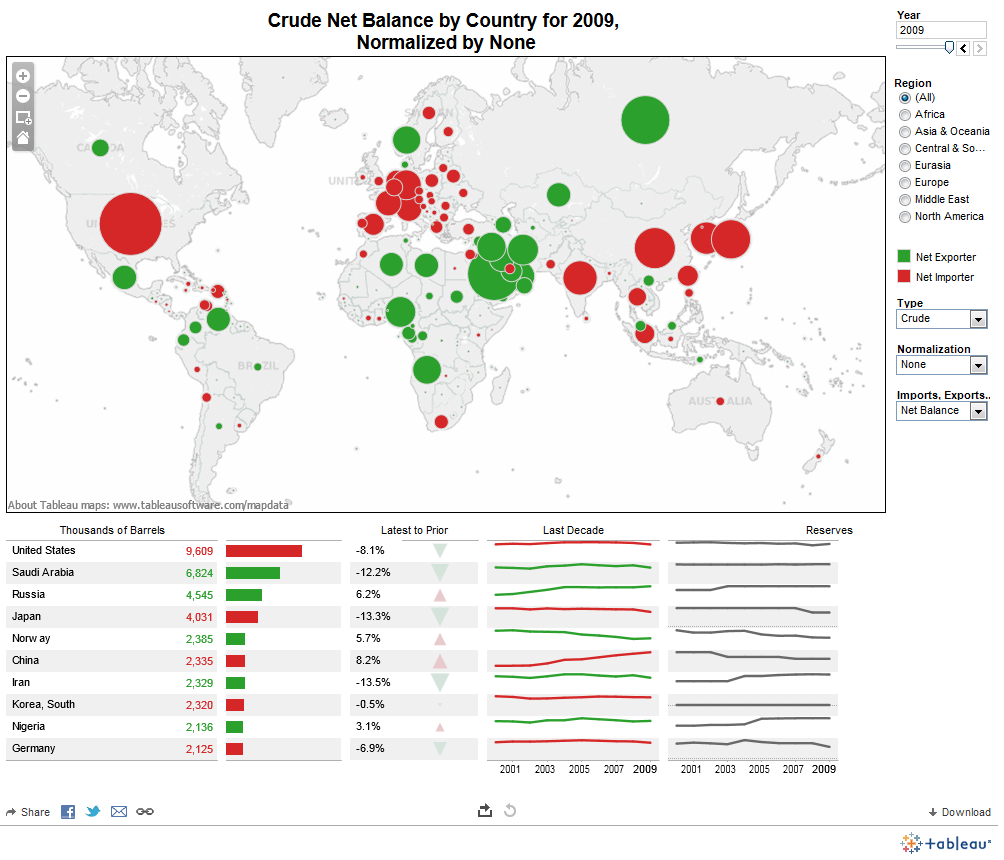
crude net balance by countryVast quantities of crude oil are exported and imported each year. Some countries are net exporters (their oil exports are larger than their oil imports), and some are net importers (their oil imports are larger than their exports).

In this visualization by Data Driven Consulting, we can see that the United States was the largest net importer of crude oil in 2009. Other net importer countries include China, India, Japan, South Korea, Germany, Belgium, Italy, UK, Spain, Singapore, and Australia.

Among the net exporters of crude oil we find Russia, Saudi Arabia, Iran, Iraq, Norway, Venezuela, Mexico, and Canada.

For the full-size interactive dashboard, visit: Tableau Public: Exporters and Importers


Total Carbon Emissions by Country

The Kyoto Protocol is an international treaty that seeks the reduction of greenhouse gases that contribute to global warming by setting emission reduction targets for industrialized nations. The Kyoto Protocol was signed on December 11, 1997 in Kyoto (Japan) by 191 countries. The United Stated signed the treaty, but later it did not ratify it.

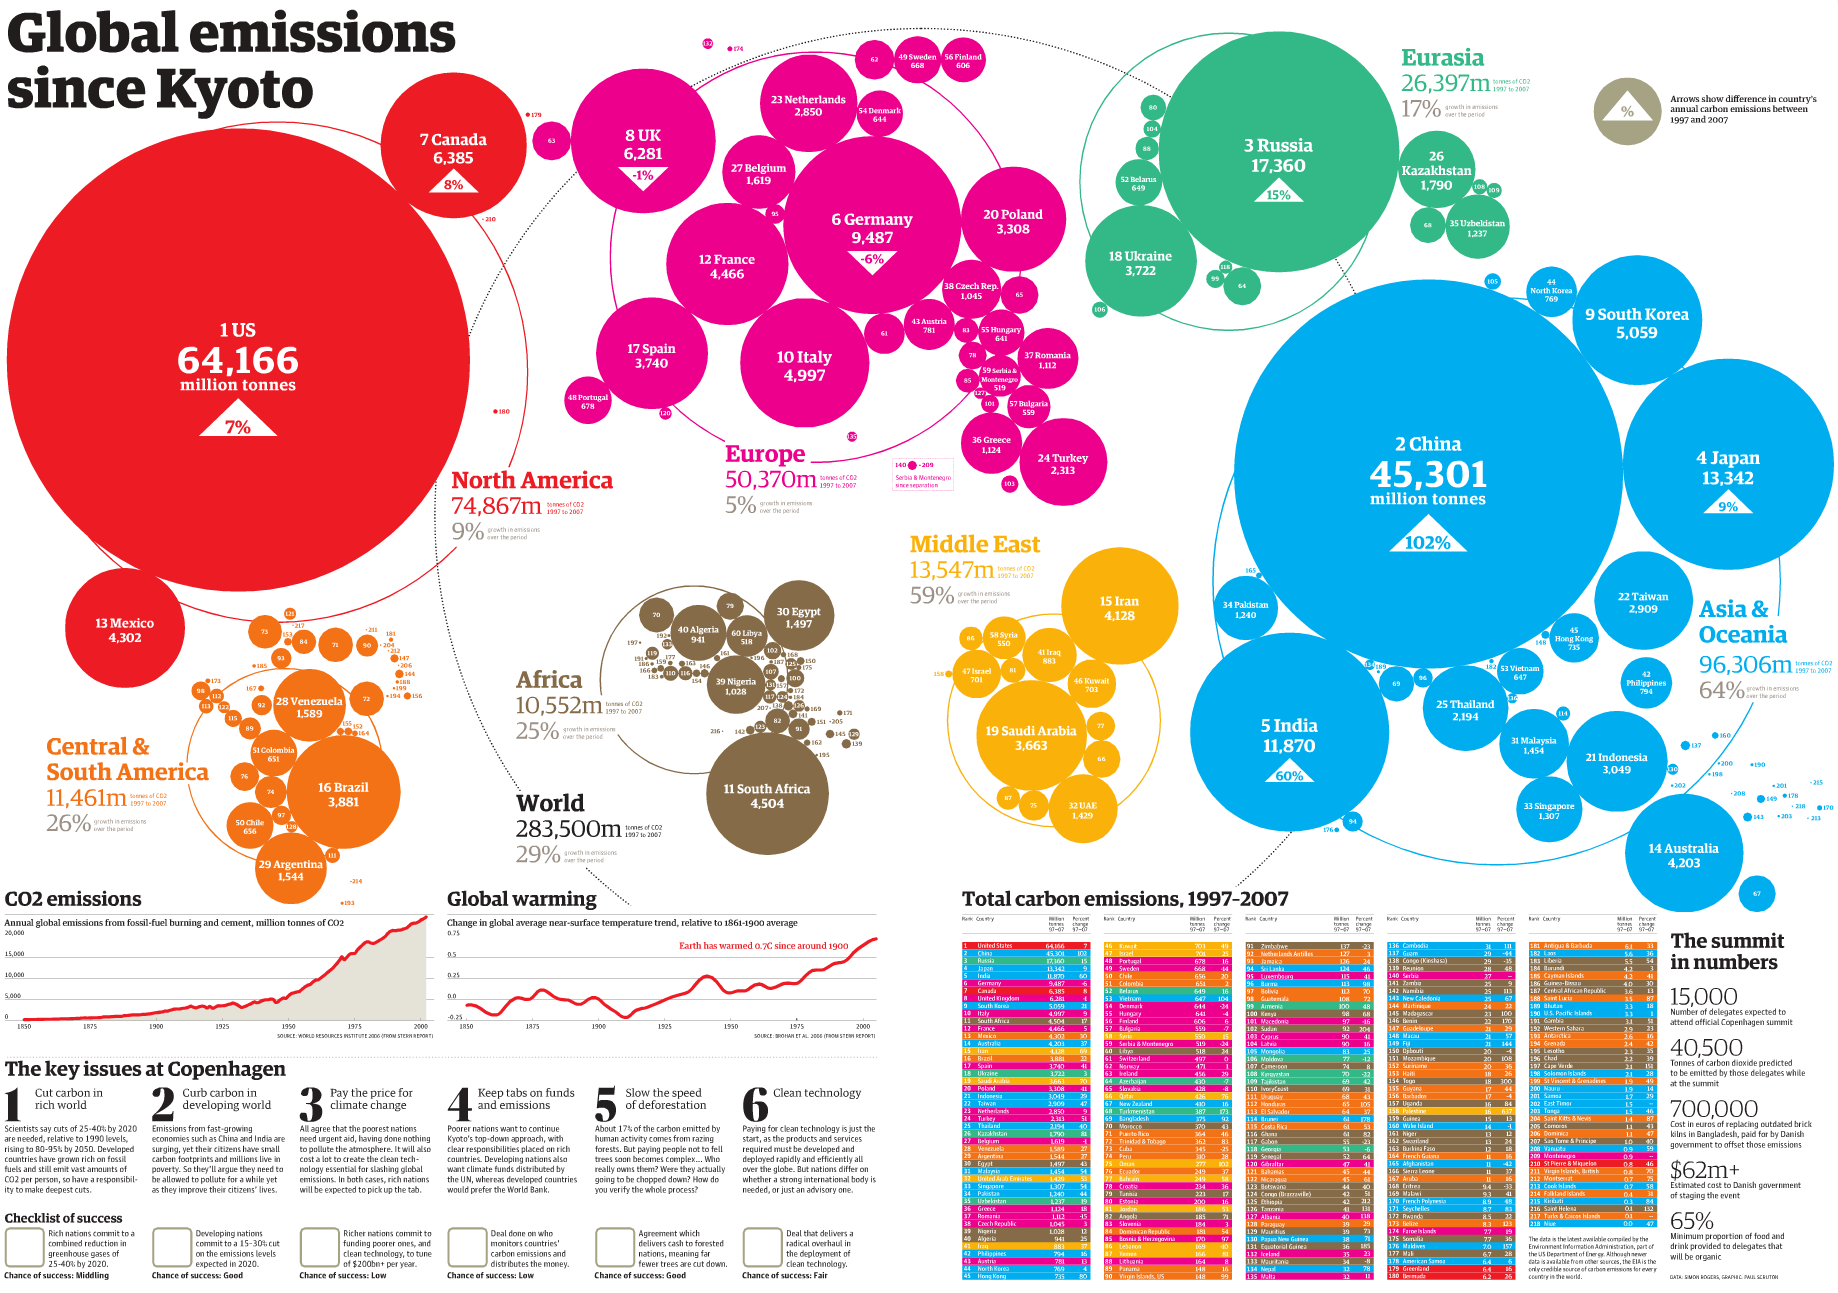
This visualization by The Guardian shows total carbon emissions by country between 1997 and 2007, ten years since the protocol was signed.

The United States is the country that has produced the largest amount of carbon emissions (64,166 million tonnes) in the period 1997-2007 followed by China, Russia, Japan, India, and Germany.

Asia and Oceania combined are the regions with the highest carbon emissions produced in the same period (96,306 million tonnes). Asia and Oceania are followed by North America (U.S., Canada, and Mexico) with carbon emissions of the order of 74,867 million tonnes, and Europe with carbon emissions at 50,370 million tonnes as of 2007.