Tag Archives: New York

How many people die every day in New York?

According to the US Census Bureau, approximately 452 people die every day in the state of New York. In other words, a person dies in New York approximately every 3 minutes. You can see a live clock keeping track of how many people have died today at https://www.indexmundi.com/clocks/indicator/deaths/united-states/new-york. You can compare the number of deaths in New York to the number of deaths in other states at https://www.indexmundi.com/clocks/indicator/deaths/united-states.

As for the number of daily deaths in New York City, we estimate based on 2018-2019 US Census numbers that approximately 194 people die every day in NYC.

Note that the numbers in this post were estimated without taking into account the effects of the coronavirus (COVID-19) pandemic. The net effect of the pandemic on the average number of daily deaths in New York will not be clear until some time in the future. For more information about COVID-19 cases and deaths in the US, visit our coronavirus information page.
The Most Expensive Office Locations by Country

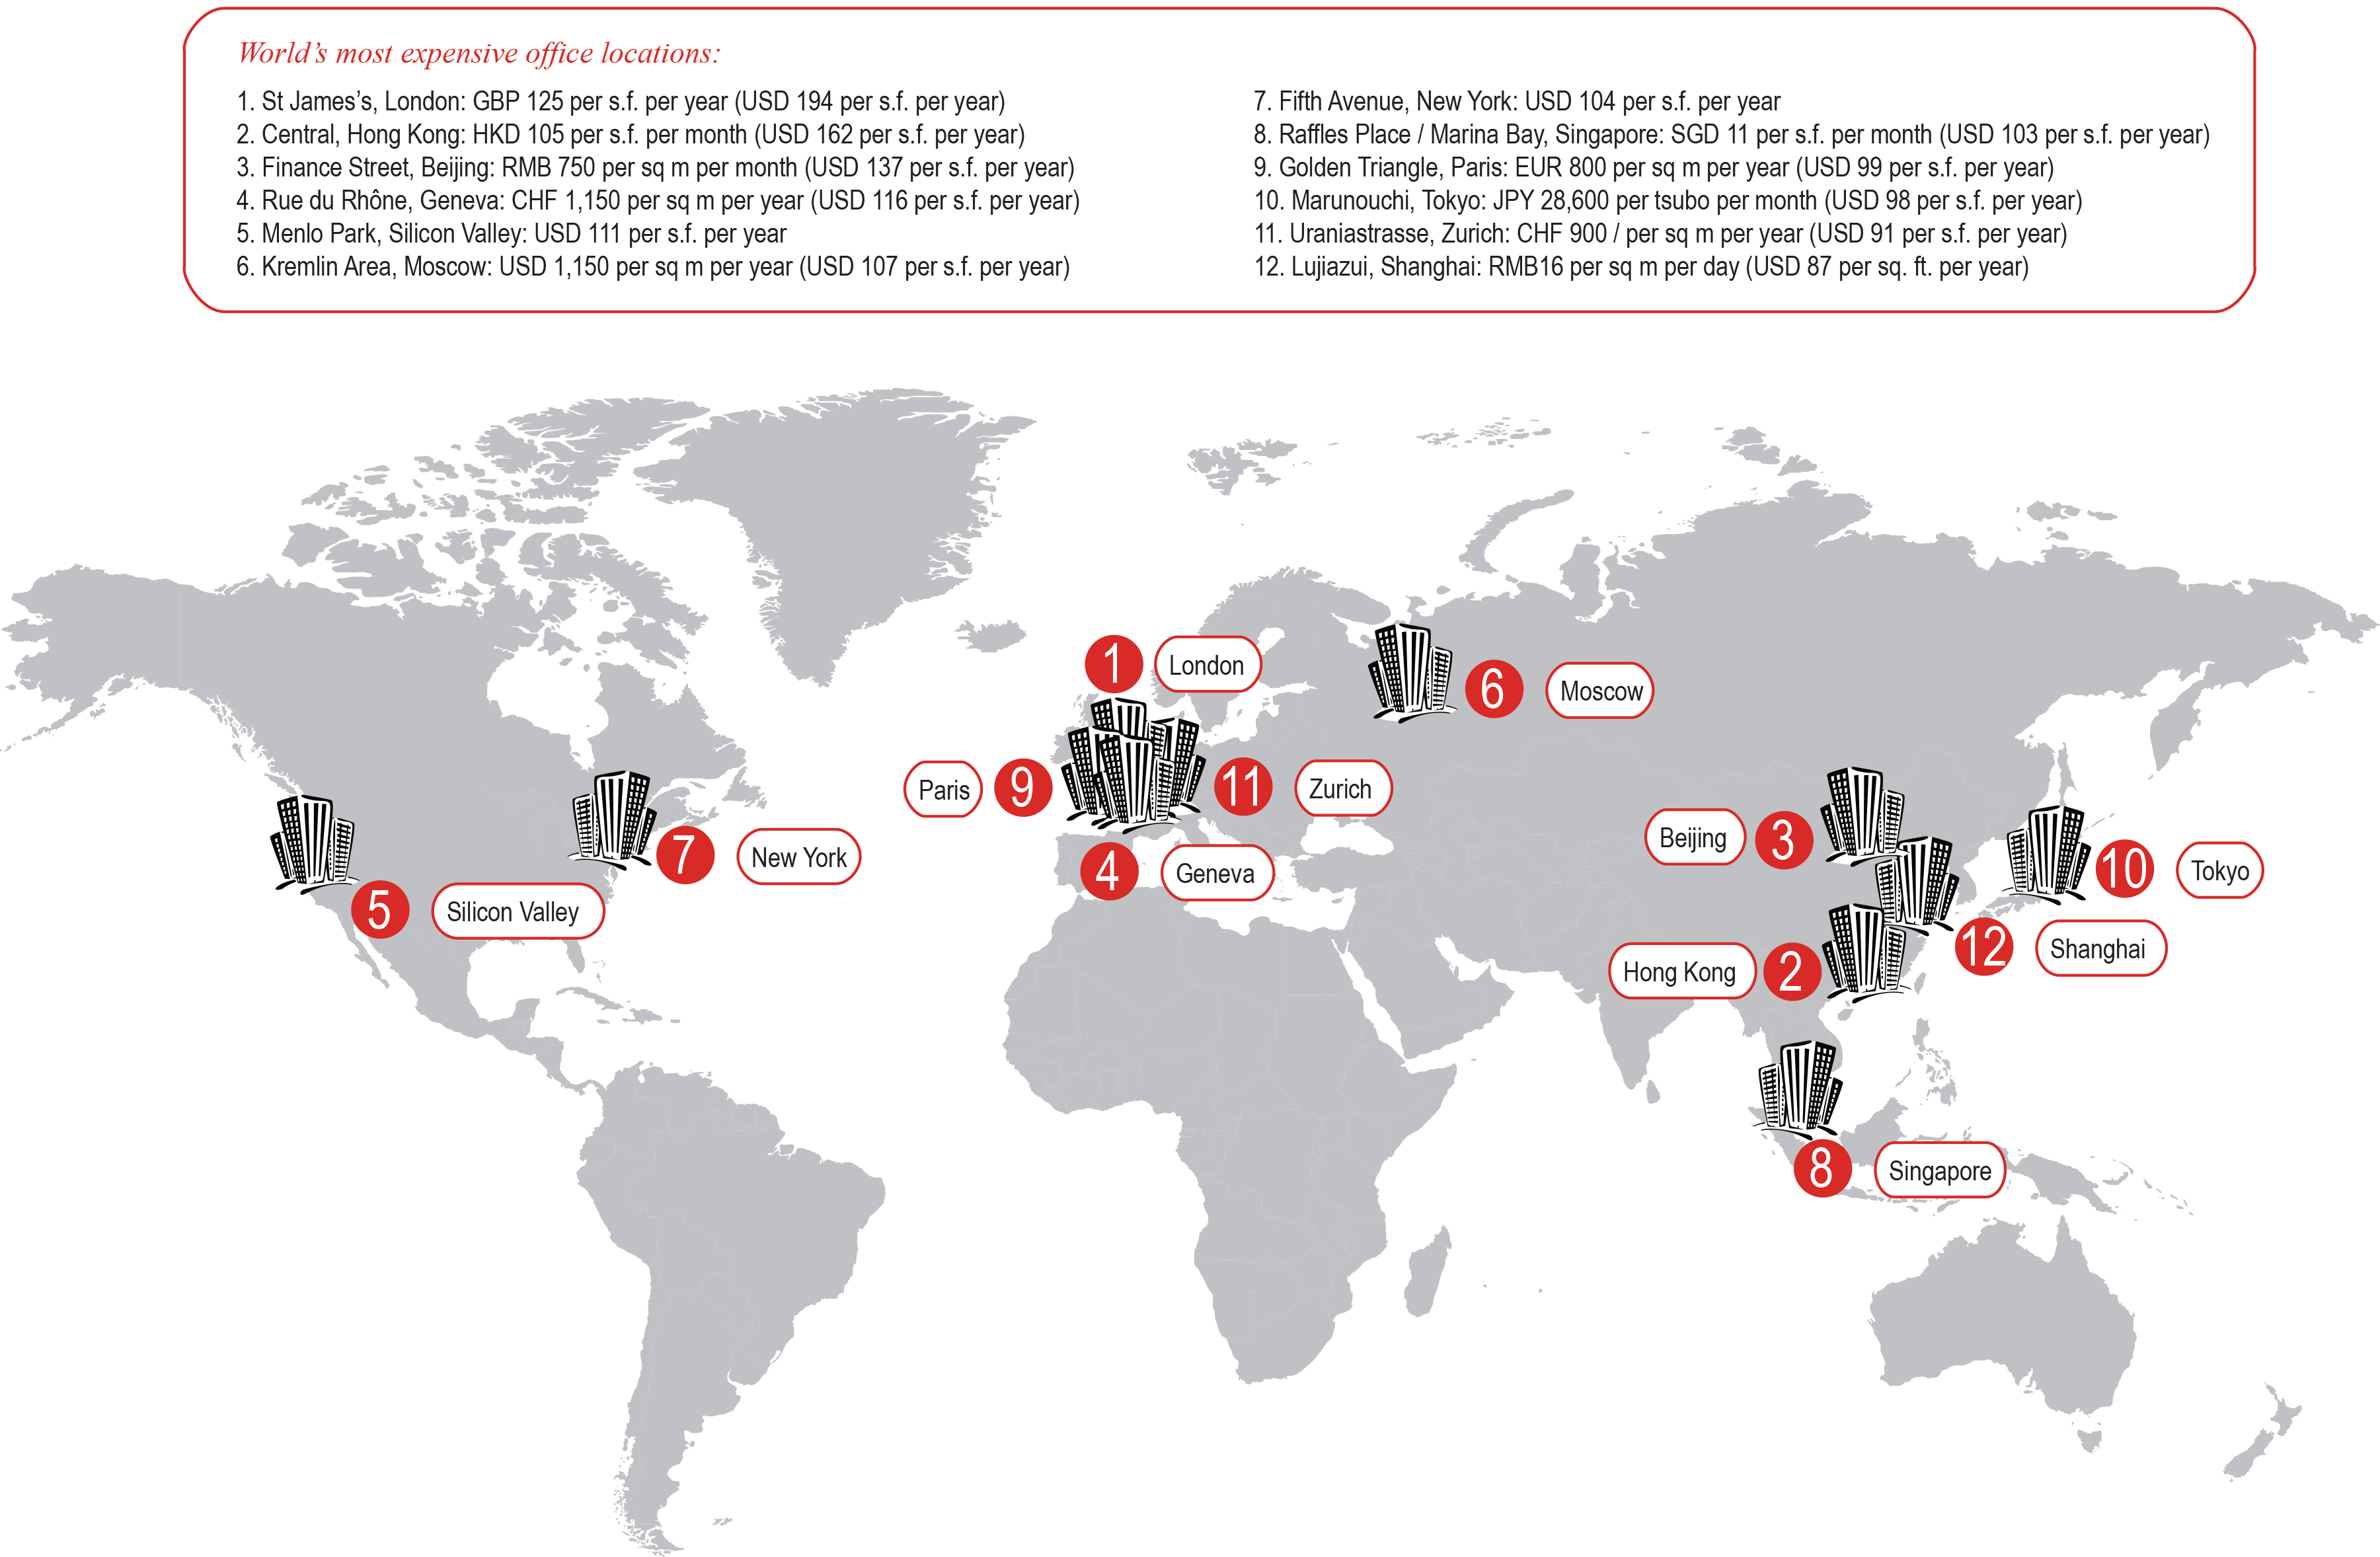
World's most expensive office locations

Expensive office locations around the world share similar characteristics: they are located in premier trade and financial centers, they are sites for corporate headquarters, they are located in areas where property availability is scarce and therefore expensive, and they are located close to their most wealthy customers.

As we can see in the map above, the most expensive office spaces are located in Europe, Asia and the United States. London’s St. James area leads as the most expensive location for office space. London is followed by Hong Kong’s Central area, Beijing’s Finance Street, Geneva’s Rue du Rhône, and Silicon Valley’s Menlo Park.

Source: LinkedIn: Paying the Rent: The World’s 12 Most Expensive Office Locations


Climbing the Income Ladder in the U.S.

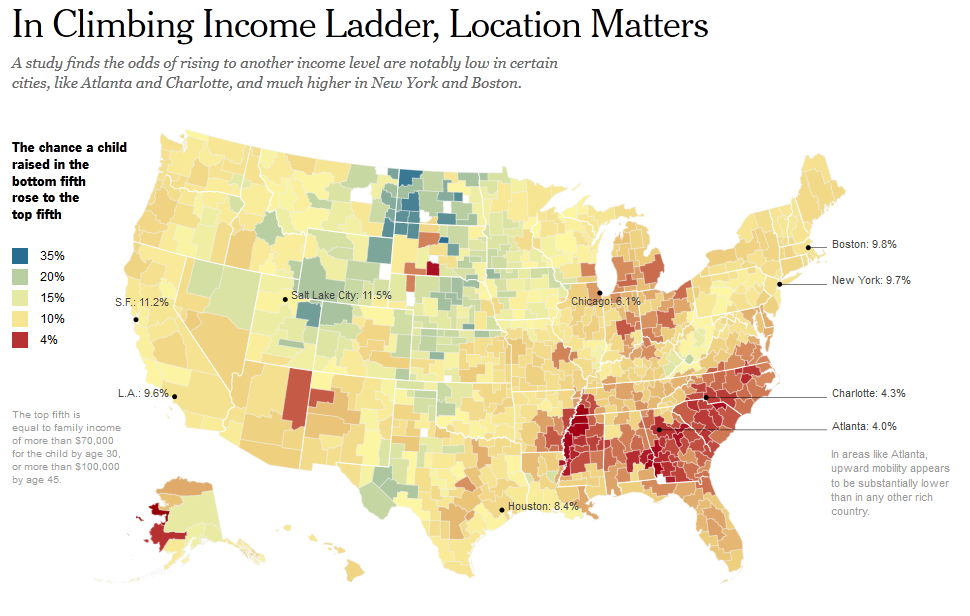
us climbing income ladderAccording to an article published by the New York Times it matters where you grow up in terms of upward income mobility in the United States.

The chance that a child raised in the bottom fifth (bottom 20%) will rise to the top fifth (top 20%) varies significantly within each state and across states as well. The odds are particularly bleak for the Southeast. In cities like Charlotte, Atlanta, Raleigh, to name a few, the chances of upward mobility are few, 4% or less. By contrast, the chances of upward mobility are the best in areas of the Midwest and West, 20% or higher. The odds of climbing the income ladder are good in cities like Boston, New York, Salt Lake City, Pittsburgh, and Seattle.

Source: The New York Times: In Climbing Income Ladder, Location Matters


Same-Sex Marriage by State

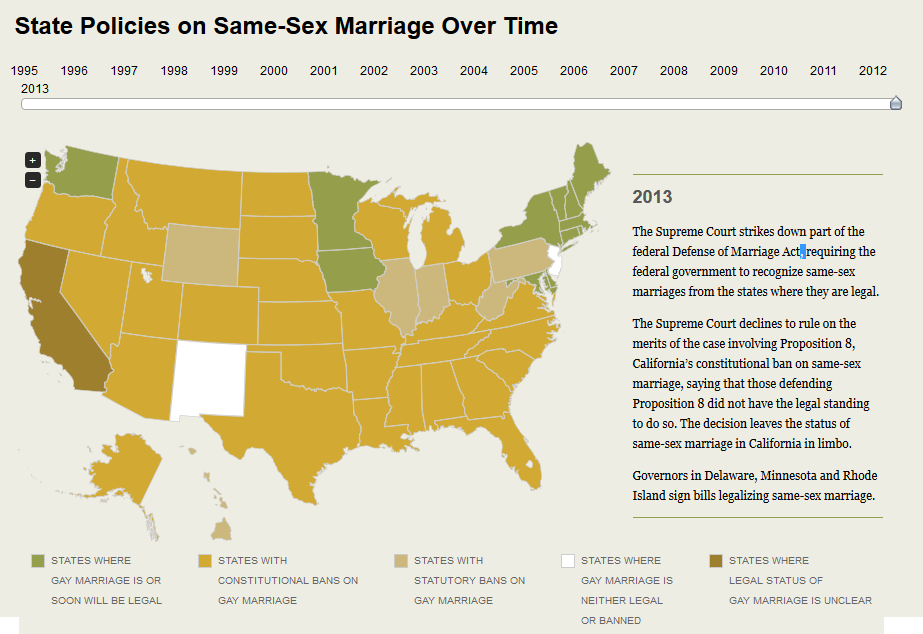
state policies on same sex marriage 2013The Supreme Court stroke down the Defense of Marriage Act (DOMA) on June 26th, 2013 ruling in favor of recognition of same-sex marriage by the federal government in states where it is already legal.

To date, 12 states have already legalized same-sex marriage: Massachusetts (first state to do so in 2003), Connecticut, Delaware, Maryland, Minnesota, New Hampshire, New York, Rhode Island, Vermont, Washington state, Maine, and Iowa. The District of Columbia also legalized gay marriage. Additionally, 8 states have certain legal provisions and civil unions for gay couples: California, Colorado, Hawaii, Illinois, Nevada, New Jersey, Oregon, and Wisconsin.

Several states are still against same-sex marriage, and 29 of them amended their constitutions to ban it.

For the interactive map, please visit: Pew Research Center: Same-Sex Marriage State-by-State


Gasoline Spending by State in the U.S.

gas guzzlers mint finalMint.com tracked how much its users spend on gasoline in one month, and how many times they visit the pump in the same period across the United States.

On average, Americans spend $177 on gas in single month, making an average of 6 visits to the pump, and spending an average of $32 in each transaction.

San Jose (California) stands out as the city where Mint users spend the most on gas, an average of $216 in a single month. Other cities where Mint users spend a lot on gas include Birmingham (Alabama), Jacksonville (Florida), Phoenix (Arizona), and Charlotte (North Carolina) to name a few. In contrast, in cities like New York, Brooklyn (New York), and Washington D.C., which have a good public transportation system, the gas bill is between $102 and $112 per month.

Source: Mint: Gas Guzzlers


Terrorist Attacks in the U.S. Since 1970

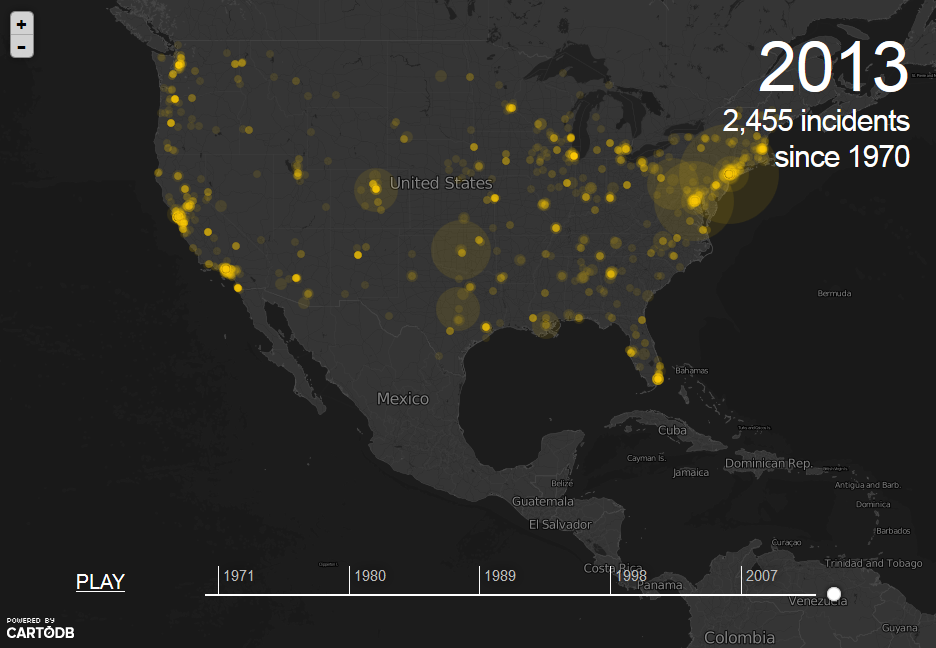
The Guardian has published this interactive map pinpointing the location of terrorist attacks in the United States since 1970.

A total of 2,455 incidents have occurred between 1970 and 2011. Most of the attacks have happened in the Northeast, and the largest number of casualties is also concentrated in that region (large-size circles).

Source: The Guardian: Data Blog – Four decades of US terror attacks listed and detailed


Ways of Transportation in Six Selected Cities

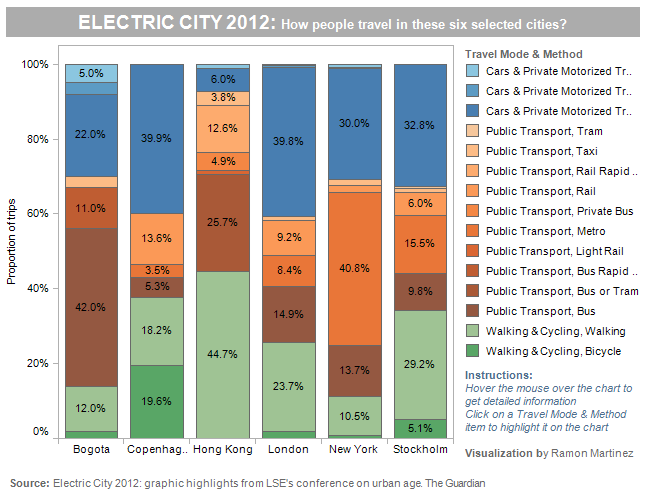
Interesting transportation patterns emerged from the 2012 LSE Cities conference, which focused in the way cities across the globe adjust to technological innovation and environmental changes.

The graph above displays transportation patterns for six selected cities: Bogota, Copenhagen, Hong Kong, London, New York, and Stockholm. Of the six selected cities, Hong Kong is where walking and biking are the most common ways of transportation, a good 44.7%, and where cars and other private motorized vehicles are used the least (7.2%). Copenhagen and London, are the cities where the most common way of transportation are cars and other private motorized vehicles (39.9% and 39.8% percent respectively). New York city and Bogota are the cities where public transportation is most commonly used (57.9% and 56% respectively). In Stockholm, all three ways of transportation (walking/biking, private cars, and public transportation) are used almost in similar proportion.

For more detailed information visit:


Megacities Around the World

click to enlarge

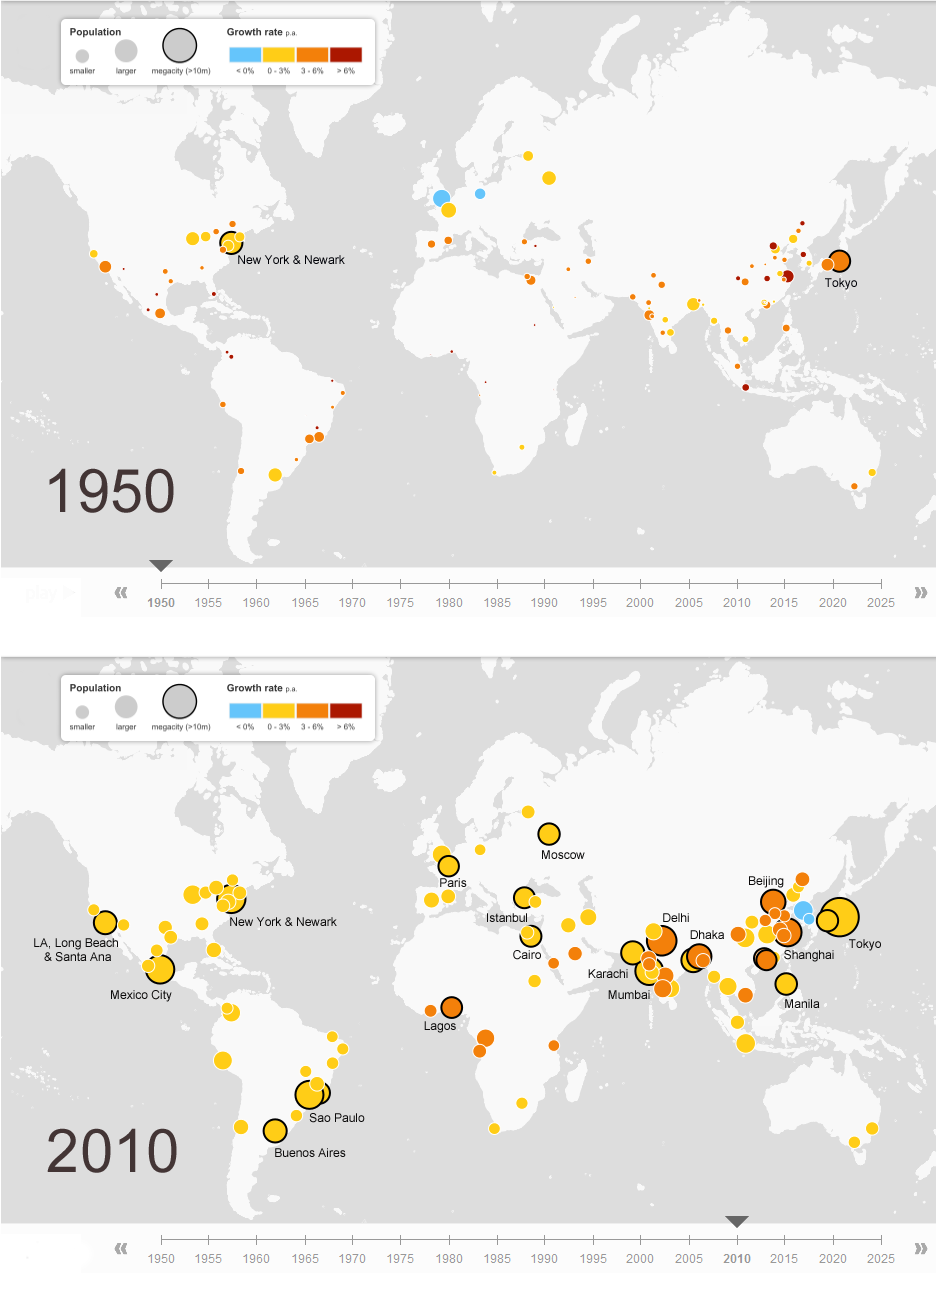
Back in 1950, New York and Tokyo were the only two megacities, with populations larger than 10 million inhabitants. By 2010 the number of megacities had increased to 23, including cities like Mexico City, Los Angeles, Sao Paulo, Rio de Janeiro, Buenos Aries, Paris, Moscow, Cairo, Istanbul, Delhi, Karachi, Mumbai, Dhaka, Beijing, Shanghai, Manila, besides New York and Tokyo, the largest megacity with a population of 36.9 million. For 2025, it is estimated that there will be 29 megacities around the globe. Click here for the interactive map.