Tag Archives: Russia

Cancer Death Rates for Men and Women

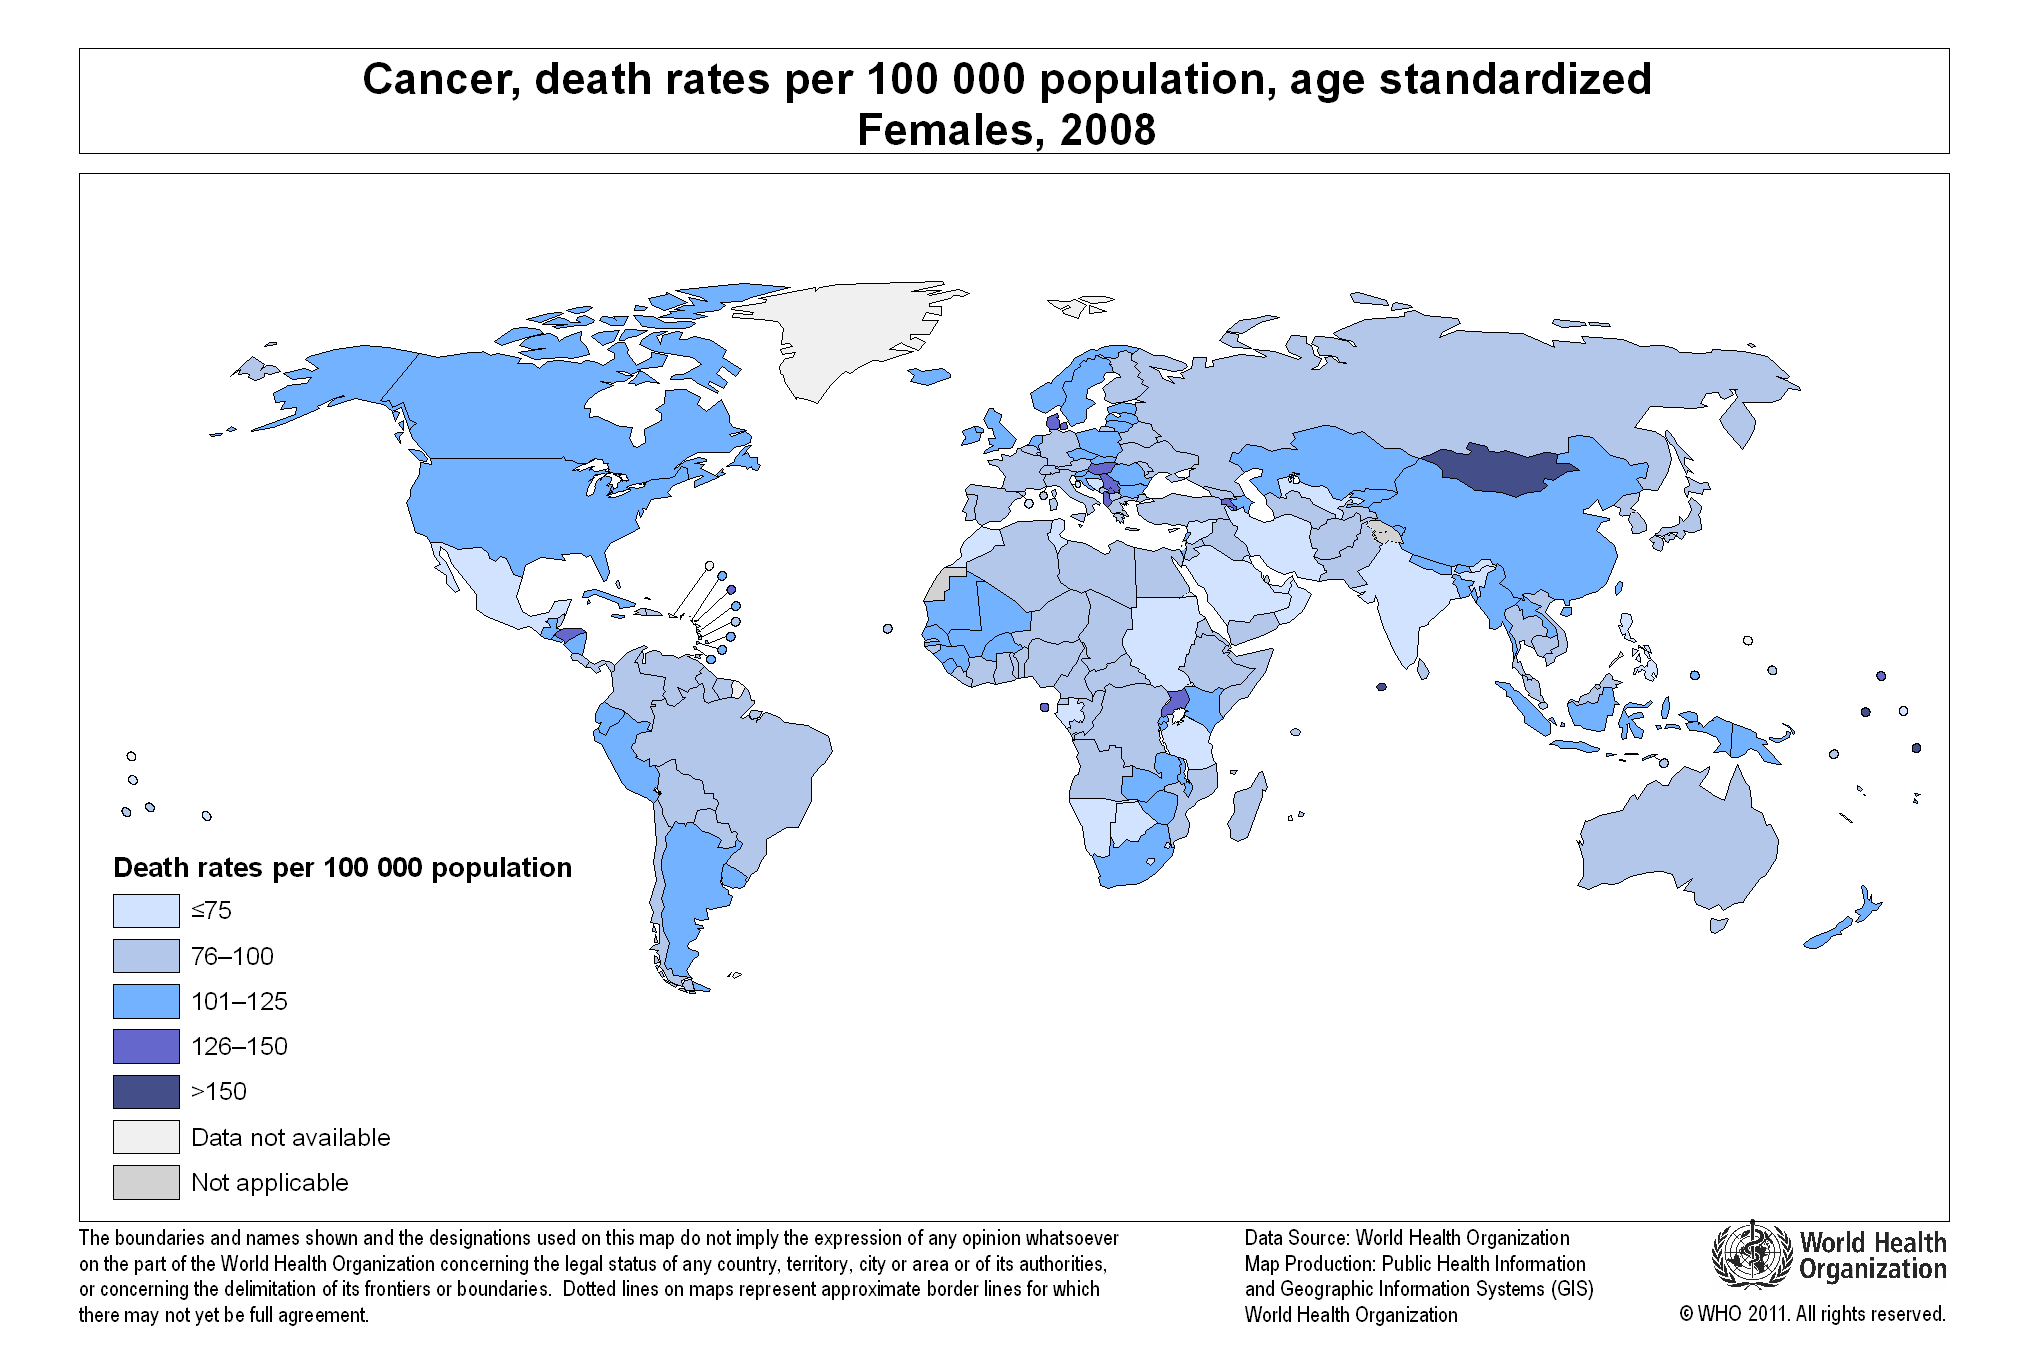
Cancer affects both women and men globally. However, cancer death rates are different for each gender, as can be seen in the two maps displayed in this article.

We find the highest cancer death rates for women (126 or more per 100,000 population) in Mongolia, Denmark, Albania, Macedonia, Uganda, and Honduras.
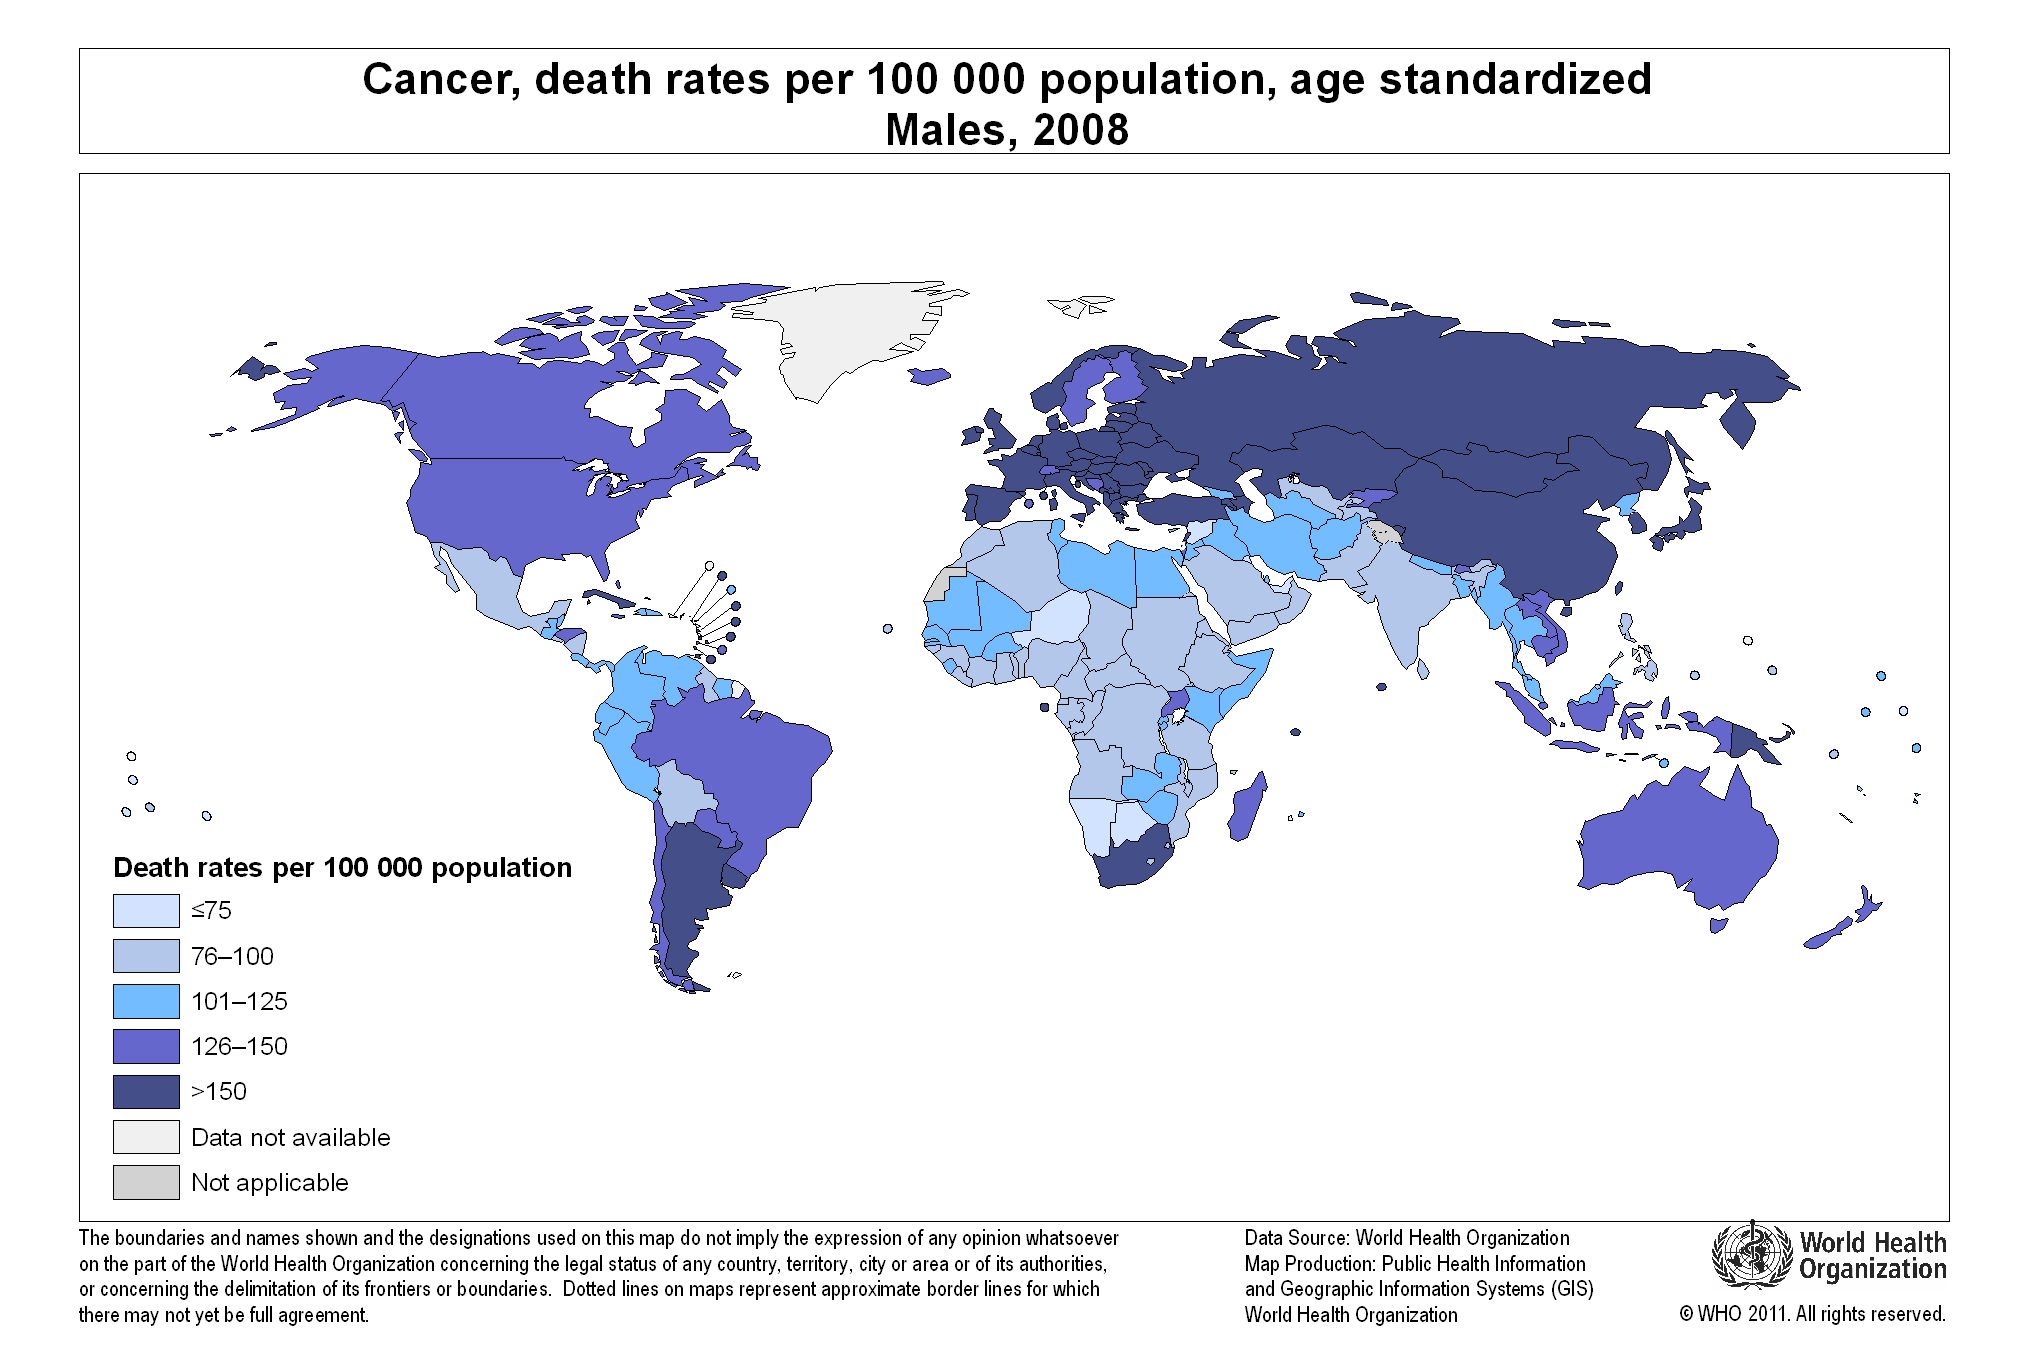
The cancer death rate for men is the highest (150 per 100,000 people) in most parts of the world, compared to women. Countries with high death rates for males include most European countries, Middle Eastern nations, Russia, Mongolia, Kazakhstan, China, Japan, South and North Korea, Turkey, South Africa, Argentina, Uruguay, and Cuba. Other countries with high death rates for males (126 or above per 100,000 people) include the United States, Canada, Brazil, and Australia.

We can only speculate about the factor behind this disparity in numbers of cancer death rates for men and women worldwide.

For detailed information, please visit:


Paid Maternity Leave Worldwide

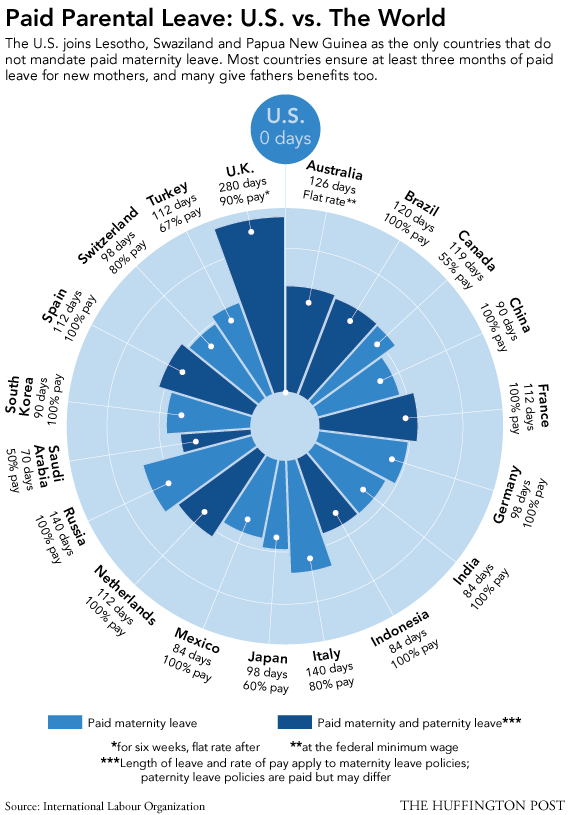
Many developed nations provide paid maternity leave to their female employees. This is not the case for the United States.

According to this visualization by the Huffington Post, the UK provides the highest number of paid maternity leave days, 280 with 90% pay. Brazil, China, France, Germany, India, Indonesia, Mexico, Netherlands, Russia, South Korea, and Spain, offer maternity leave with 100% pay.

In the U.S., parents are guaranteed their jobs for 90 days while on maternity or paternity leave, but without pay. Other countries that do not provide paid maternity leave include Lesotho, Swaziland, and Papua New Guinea, all developing nations.


Meteorite Impacts Around the Globe

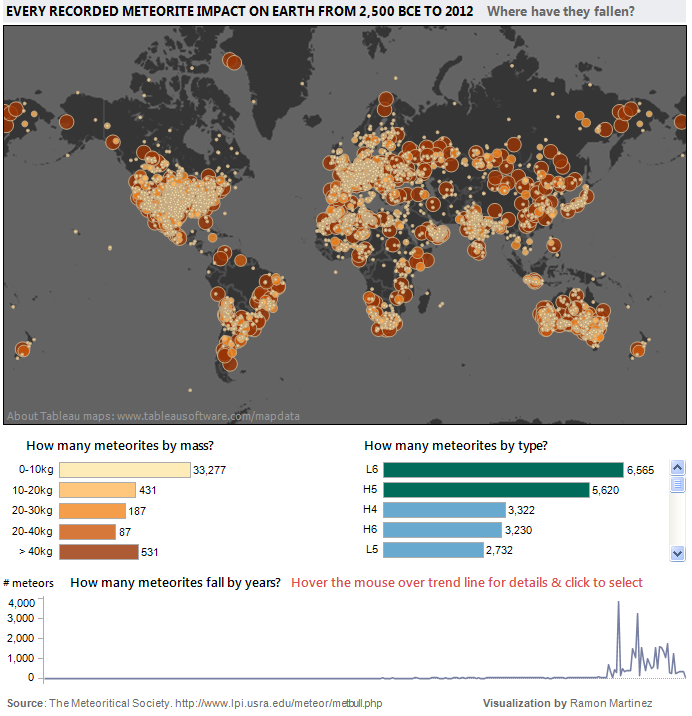
Between 2500 B.C. and 2012, a total of 34,513 meteorite impacts have been registered, 33,277 (96%) of them with a mass of 10 Kg. or less. Only 531 meteorites with a mass of 40 Kg. or more, have been recorded in the same time period. The most common type of meteor registered is the L6 (19%), followed by types H5 (16%), H4, H6,and L5.

In the lower graph it is interesting to note, that the frequency of meteor impacts remained relatively constant until the year 1974, when we start to see spikes and larger numbers of registered impacts that continue to the present.

For the interactive map, visit: Health Intelligence: Registered meteorites that has impacted on Earth visualized


Military Spending Worldwide

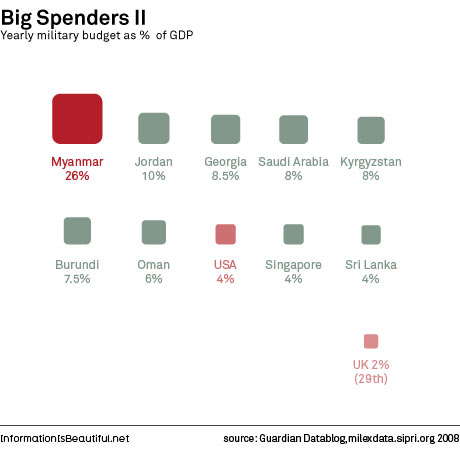
According to an article of The Guardian, in 2008 the defense budget of the United States was $607 billion, ten times that of China and the UK, fifteen times that of Germany, seventeen times that of Russia, and twenty five times that of India. In fact, the defense budget of the top nine countries combined (shown in the first graphic) adds up to $377 billion, or 62% of the military spending of the U.S. Those numbers would make the U.S. the top country in defense spending in the world.

But, if one looks at defense spending numbers as a percentage of the GDP, we have a different story. In that case, Myanmar becomes the top defense spender with a military budget of 26% of its GDP, followed by Jordan, Georgia and Saudi Arabia. The U.S. moves to number eight, with a military budget of 4% of its GDP. Large military spending by these nations is due to different factors. Some of these countries are dictatorships, some are monarchies. Others need to actively protect their borders from foreign aggression.

To read the article from The Guardian, visit: The Guardian: Data Store – Show and Tell, Information is beautiful: war games


Cigarette Smoking Rates Around the World

click to enlarge

A color-coded map featured in an article by the Washington Post, shows annual per capita smoking rates by country. Serbia, Russia, and other countries in Eastern Europe, are the heaviest smokers, with an average consumption of 2,000 cigarettes per person per year. These countries are followed by Japan and South Korea, with China catching up. The U.S. and Canada are in the middle with an average consumption of 750 to 1,249 cigarettes per person per year. The healthiest countries tend to be poor countries located in Sub-Saharan Africa and in Southeast Asia, with an average consumption of up to 250 cigarettes per person per year.

Related Links:

  1. Kremlin Cracks Down on Big Tobacco – World Smoking Habits Data [Wall Street Journal]
  2. Key Facts About Smoking – [American Lung Association]


Life Expectancy vs. Fertility Rates Worldwide 1960-2010

click to enlarge

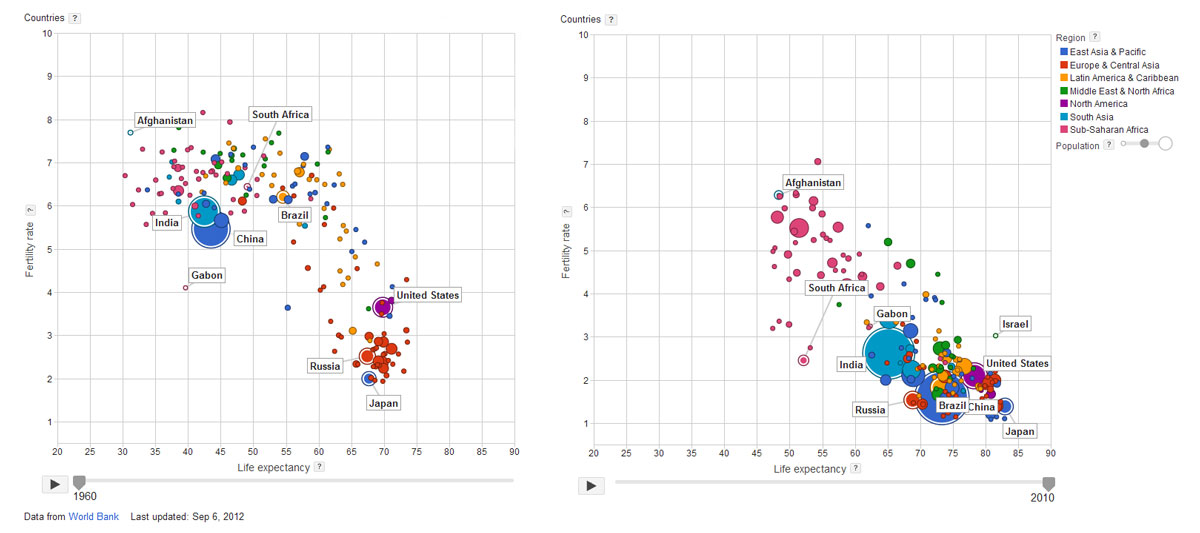
During the last fifty years, we have seen the gradual increase in life expectancy and the corresponding decrease in fertility rates worldwide. This is clearly the case of countries like China, India, the United States, Brazil, Japan, and Gabon, where dramatic improvements can be seen. On the other hand, countries like Russia, South Africa and Afghanistan, show moderate improvement.

It is very interesting to note, that although they have improved, a large cluster of African countries remain far from the overall trend, with lower life expectancy rates and higher fertility rates. For more information, check Google’s interactive bubble chart based on World Bank data.