Tag Archives: UK

Deaths by Hepatitis vs. Deaths by HIV by Country

hepatitis and hiv world HIV killed 1.47 million people in 2010. Viral hepatitis killed as many as 1.44 million people in the same year. Even though the number of deaths caused by viral hepatitis follows close that of HIV, its impact goes largely ignored worldwide.

According to The Economist, viral hepatitis killed more people in 117 out of 187 countries, including China, India, Japan, and the UK. In the map above, countries in dark red show a higher ratio of deaths by viral hepatitis to deaths caused by HIV. Those countries include Egypt, Mongolia, UK, Turkey, Yemen, Iraq, South and North Korea, Japan, Finland, Sweden, Poland, and Germany.

Source: The Economist: The other killer – Hepatitis kills more people than HIV in most countries


Oil Production and Consumption by Country

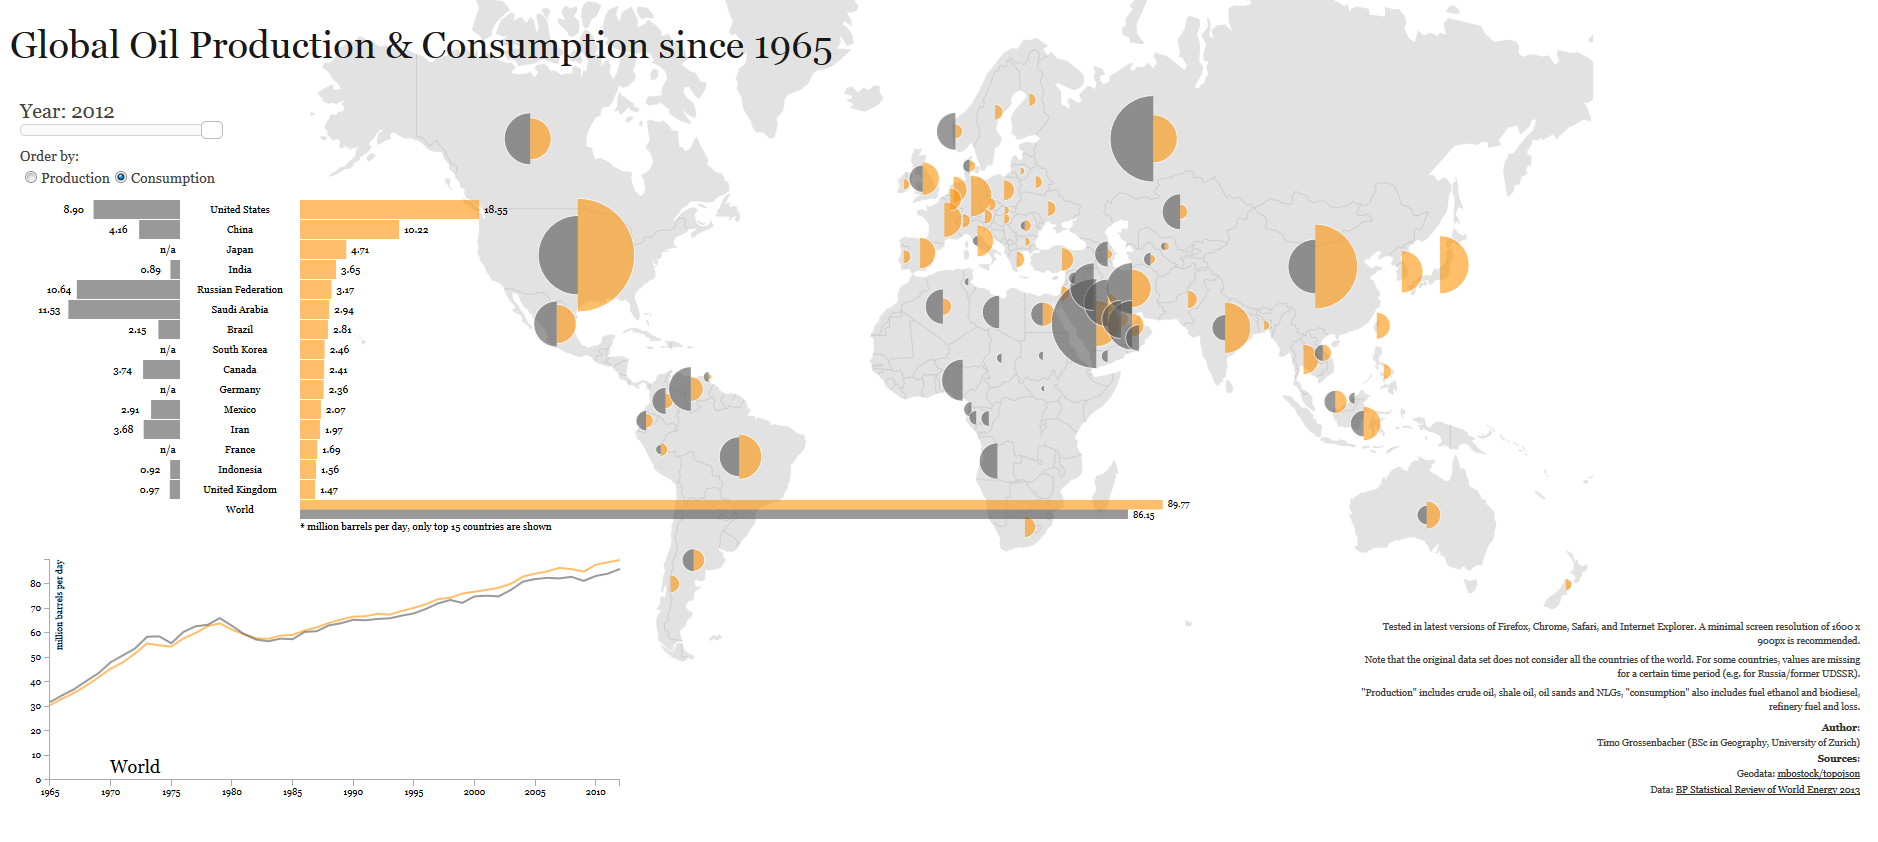
oil production and consumption since 1965When it comes to oil production and consumption, countries have a very close relationship of interdependence with each other. Some countries consume more oil than what they produce relying on imports to satisfy their internal demand. Others, consume less than what they produce, being able to export oil to nations that need it.

Oil consumption (yellow) for the United States, for example, was larger than its production (grey) for 2012, 18.55 mb/d (million barrels per day) compared to 8.9 mb/d, importing more than double its production to satisfy the gap in internal demand. Other nations with oil consumption higher that oil production include China, Brazil, Australia, India, UK, and Indonesia.

In contrast, oil consumption for Saudi Arabia for 2012 is estimated at 2.94 mb/d, while its production reached 11.53 md/d, exporting its oil surplus to the rest of the world. Other nations whose oil production exceeds its oil consumption include Canada, Mexico, Venezuela, Norway, Russia, Kuwait, United Arab Emirates, and Qatar.

Source: Winston Smith Labs: Global Oil Production and Consumption since 1965 [Interactive Map/Graph]


Global Carbon Footprint by Country

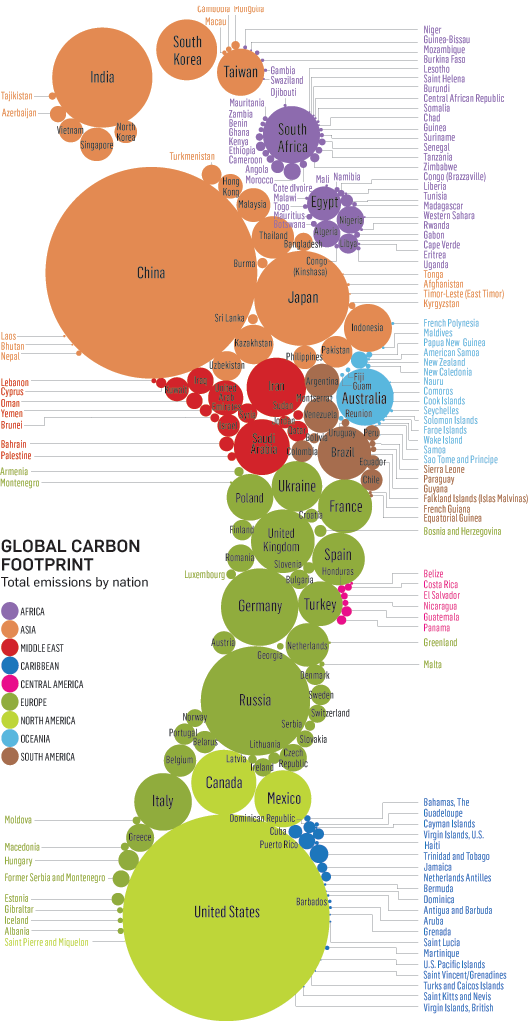
carbon footprint by countryThis original visualization by Stanford Kay shows total carbon emissions by country. Using different colors to differentiate each region, the size of the circle depicts the carbon footprint of each country.

Countries with the largest carbon footprint include China, United States, Russia, India, Japan, Germany, South Korea, Australia, UK, Iran, Saudi Arabia, Brazil, Taiwan, Ukraine, France, and Spain.


Global Attitudes About the Economy

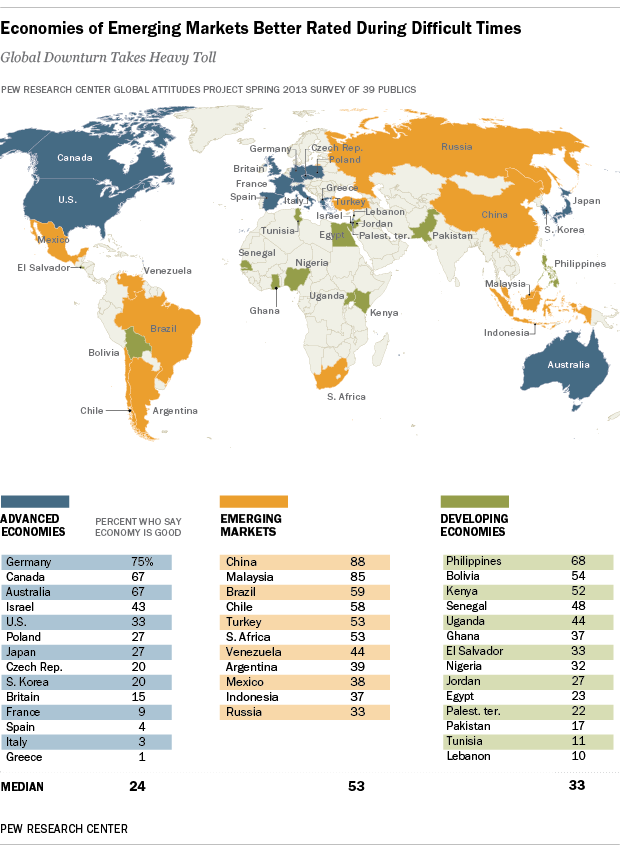
global attitudes about the economyA survey conducted by the Pew Research Center in 39 nations, regarding attitudes about the state of the economy in the respondents’ respective countries, yielded interesting results.

Respondents in emerging economies are the most optimistic. A median of 53% believe their economy is doing well, specially in China and Malaysia. In contrast, respondents in developed economies are the most pessimistic. A median of only 24% say their economy is doing well. European nations such as Greece, Italy, Spain, and France are the most pessimistic of all.

In the case of developing economies, some are somewhat optimistic (Philippines and Bolivia), and other not so much (Tunisia and Lebanon).

Source: Pew Research Global Attitudes Project: Widespread Dissatisfaction with Economy

Read full report: Pew Research Global Attitudes Project: Economies of Emerging Markets Better Rated During Difficult Times


Number of Nuclear Tests Since 1945

North Korea conducted its third nuclear test on February, 2013. Two nuclear test preceded this one, the first in 2006, and the second in 2009.

However, the nation that has performed the largest number of nuclear tests since 1945 is the United States, a total of 1,032. In the same period, the USSR/Russia performed a total of 715 nuclear tests, and France performed a total of 210 nuclear tests.

Source: Statista: North Korea Conducts Third Nuclear Test


Body Mass Index (BMI) by Country

A body mass index (BMI) between 18.5 and 24.9 is usually considered a healthy body weight to height relationship. A BMI of 25 or higher indicates body weight not optimal for the height of a particular person.

This visualization published by Visual.ly, shows the different BMI values for adult men and women across the globe.

Countries with a healthy average BMI between 20 and 22.9 include several nations in Africa, Yemen, India, Thailand, Japan, Pakistan, Singapore, among others.

Countries with an average BMI between 23 and 24.9 include several Asian nations, several European nations (including France), some nations in Africa, and Honduras.

Countries with an average BMI between 25 and 26.9 include Canada, Russia, Costa Rica, Colombia, Israel, Austria, Switzerland, Brazil, all Nordic countries, Spain, Portugal, and nations in the Middle East.

Countries with an average BMI of 27 and over  (the highest BMI range) include the United States, Kuwait, Cuba, Argentina, Chile, Bolivia, Peru, Venezuela, Australia, UK, New Zealand, Greece, and Germany to name a few.


Number of Deaths in World War II

This visualization found in Wikimedia.org, shows World War II casualties per country by number and percentage of population, as well as the percentage of military and civilian deaths for the Allied and the Axis Powers.

The countries with the largest number of casualties were the Soviet Union, China, Germany, Poland, and Indonesia. As a percentage of the population, the nations with the  largest number of casualties were Lithuania, Poland, Latvia, Germany, and the Soviet Union.

For the Allied forces, the heaviest casualties were inflicted on the civilian population, whereas the largest number of casualties for the Axis forces were inflicted on the military.


Paid Maternity Leave Worldwide

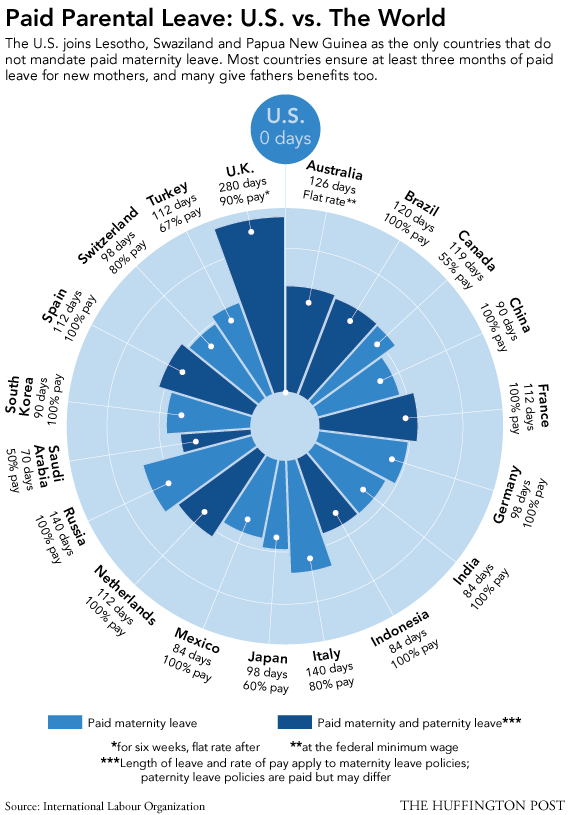
Many developed nations provide paid maternity leave to their female employees. This is not the case for the United States.

According to this visualization by the Huffington Post, the UK provides the highest number of paid maternity leave days, 280 with 90% pay. Brazil, China, France, Germany, India, Indonesia, Mexico, Netherlands, Russia, South Korea, and Spain, offer maternity leave with 100% pay.

In the U.S., parents are guaranteed their jobs for 90 days while on maternity or paternity leave, but without pay. Other countries that do not provide paid maternity leave include Lesotho, Swaziland, and Papua New Guinea, all developing nations.


Global Vitamin D Deficit

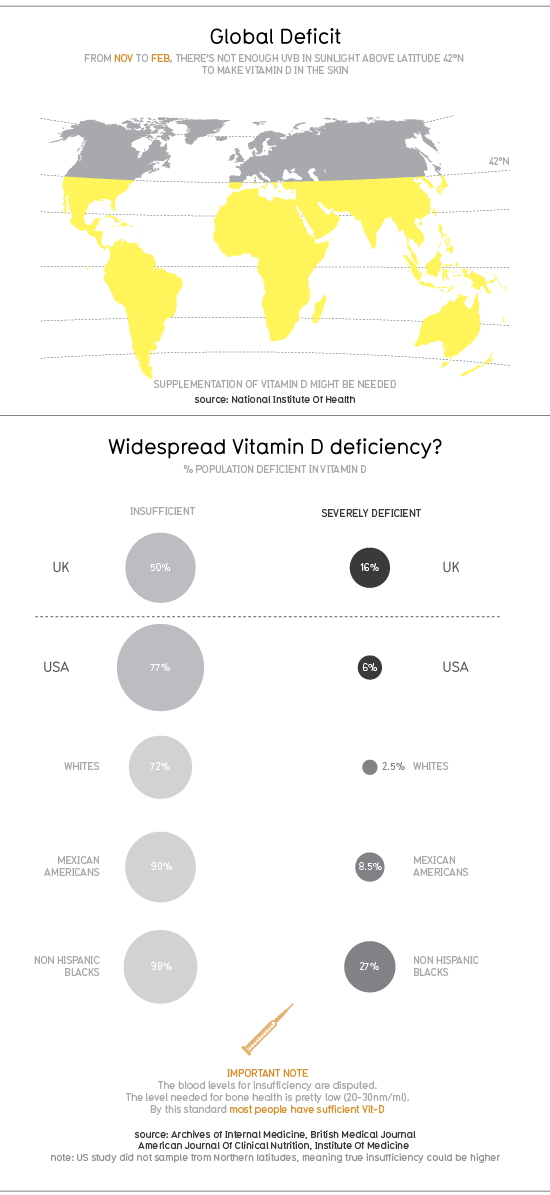
According to a 2010 infographic by Information is Beautiful, people inhabiting in the Northern hemisphere, more precisely above latitude 42°N, are not getting enough UVB light from sunlight to make vitamin D in the skin during winter season.

In the UK, 50% of the population has insufficient levels of vitamin D, while 16% of the population is severely deficient. In the United States, 77% of the population has insufficient levels of vitamin D, while 6% of the population is severely deficient. Within the U.S., the groups more affected by insufficient levels of vitamin D are Non-Hispanic blacks (98%) and Mexican Americans (90%).

To try compensate for the lack of UVB light in winter time and the consequent low vitamin D levels, consumers have turned to the vitamin D industry, an industry that is worth $460 million, as of 2009, in the U.S. alone.

For more graphics and statistics, visit: Information is Beautiful: Vitamin D

The Presence of McDonald’s Across the World

click to enlarge

One of the companies that symbolizes the dominance of US. corporations across the world is McDonald’s. McDonald’s is the second largest fast food chain in the world, according to a Nasdaq report for 2011, with more than 33,510 restaurants in 119 countries spread across all five continents.

The U.S. has the largest number of McDonald’s restaurants (13,381), followed by Japan (3,598), Canada (1,400), Germany (1,276), UK (1,250), and China (660).

The price of a McDonald’s burger is different in each country. According to the graph above, the most expensive ones can be found in Norway ($7.18), Denmark ($5.93), Iceland ($5.21), and in the Eurozone ($4.96). By comparison, the price of a McDonald’s burger in the U.S. is $3.57. These prices have been calculated using the Big Mac index published by The Economist, in order to measure the Purchasing Price Parity (PPP) between two currencies.

Resources:

  1. American Icons Temple: A Market-Dominant Minority that is McDonald’s
  2. Nasdaq: Subway tops McDonald’s for number of stores in world
  3. United States Securities and Exchange Commission – Form 10-K: McDonald’s Corporation
  4. The Economist: Big Mac Index