Tag Archives: United States

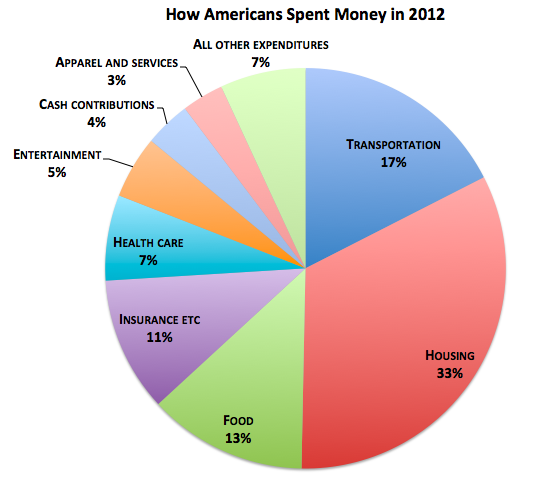
How Americans Spent Money in 2012


how americans spend money

Housing, food, transportation, and clothing account for an estimated 66% of income spent for an average American household in 2012.

According to The Atlantic, housing, food and clothing account for more than 60% of expenses for the poor. Basically, most of their income is spent is covering basic needs and not much, or none, is left for savings. The rich, by contrast, have a larger margin that can be spent in entertainment, insurance, and savings.

Source: The Atlantic: Where Americans—Rich and Poor—Spent Every Dollar in 2012


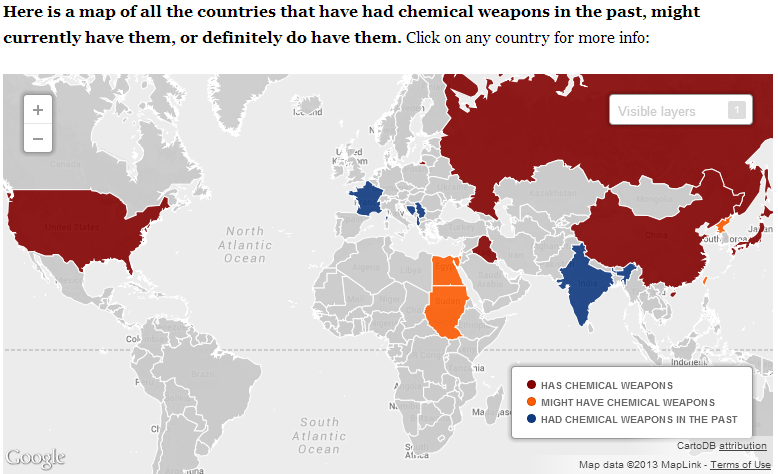
Countries With Chemical Weapons

chemical weapons

The 1925 Geneva Protocol banned the use of chemical weapons in warfare. By 1993 the Chemical Weapons Convention asked signatory nations to destroy their existing chemical weapons stockpiles and stop producing new ones.

Of the signatories, the United States and Russia are the two countries with the largest chemical weapon stockpiles. Currently, they are in the process of destroying them. Among the signatory states that have not yet ratified the Convention we find Israel and Myanmar. States that have not signed the Convention include Angola, Egypt, North Korea, South Sudan, and Syria.

Source: International Business Times: Not Just Syria: Which Other Countries Have Chemical Weapons? [Interactive Map]


Women’s Earnings by State

gender-pay-gap-graphic-final

Comparing the median earnings of full-time employed women to the median earnings of full-time employed men in the U.S., we can see there is still a gender pay gap, where women earn 77 cents per each dollar earned by their white male counterparts. This number has remained unchanged for the last ten years.

In some states women earn slightly more. That is the case for the states of Nevada (84 cents per dollar), California, Vermont, and New York. On the other side of the spectrum, there are states where women earn much less than the median. That is the case of Wyoming (64 cent per dollar), and Louisiana (67 cents per dollar).

Source: Forbes: The Geography Of The Gender Pay Gap: Women’s Earnings By State


The Economic Freedom Index 2013

economic freedom index

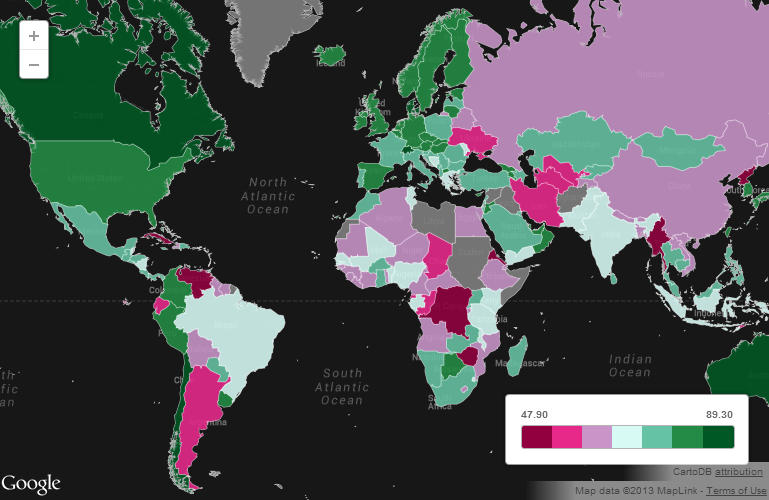
The Economic Freedom Index, compiled by the Heritage Foundation, is a measure of the economic freedom given to citizens in each of the 185 countries where it is measured. A total of ten components of economic freedom are considered, all grouped under four categories: rule of law, limited government, regulatory efficiency, and open markets.

The highest ranking country in the list is Hong Kong, with a score of 89.3, affording its citizens the highest degree of economic freedom in the world. Hong Kong is followed by Singapore, Australia, New Zealand, Switzerland, Canada, Chile, Mauritius, Denmark, and the United States, among the top ten.

On the opposite side, the most repressed countries in terms of economic freedom include North Korea, Cuba, Zimbabwe, Venezuela, Eritrea, and Burma.

Source: International Business Times: US Economic Freedom Is At Lowest Point Since 2000 [MAP]


The Higher Cost of Higher Education

higher-education-international-studentsStudying abroad can be very expensive, specially if you are looking at universities in Australia or the United States.

The average cost of higher education for international students is very high in Australia, where a student is expected to pay a total of $38,516 in annual fees and cost of living. Australia is followed by the U.S. where the average cost of one year of higher education is estimated at $35,705. Other countries with a steep tab on higher education include the United Kingdom, Canada, Japan, Singapore, and Hong Kong.

On the other hand, more affordable higher education can be found in Germany, where the average cost of one year of college annual fees plus cost of living is estimated at $6,285. Other countries with affordable higher education include Spain, Taiwan, China, and Russia.

Source: International Business Times- International Students: Higher Education Is Really Inexpensive In Germany, But Not In The US [CHARTS]


Minutes of Minimum-Wage Work to Buy a Big Mac Burger

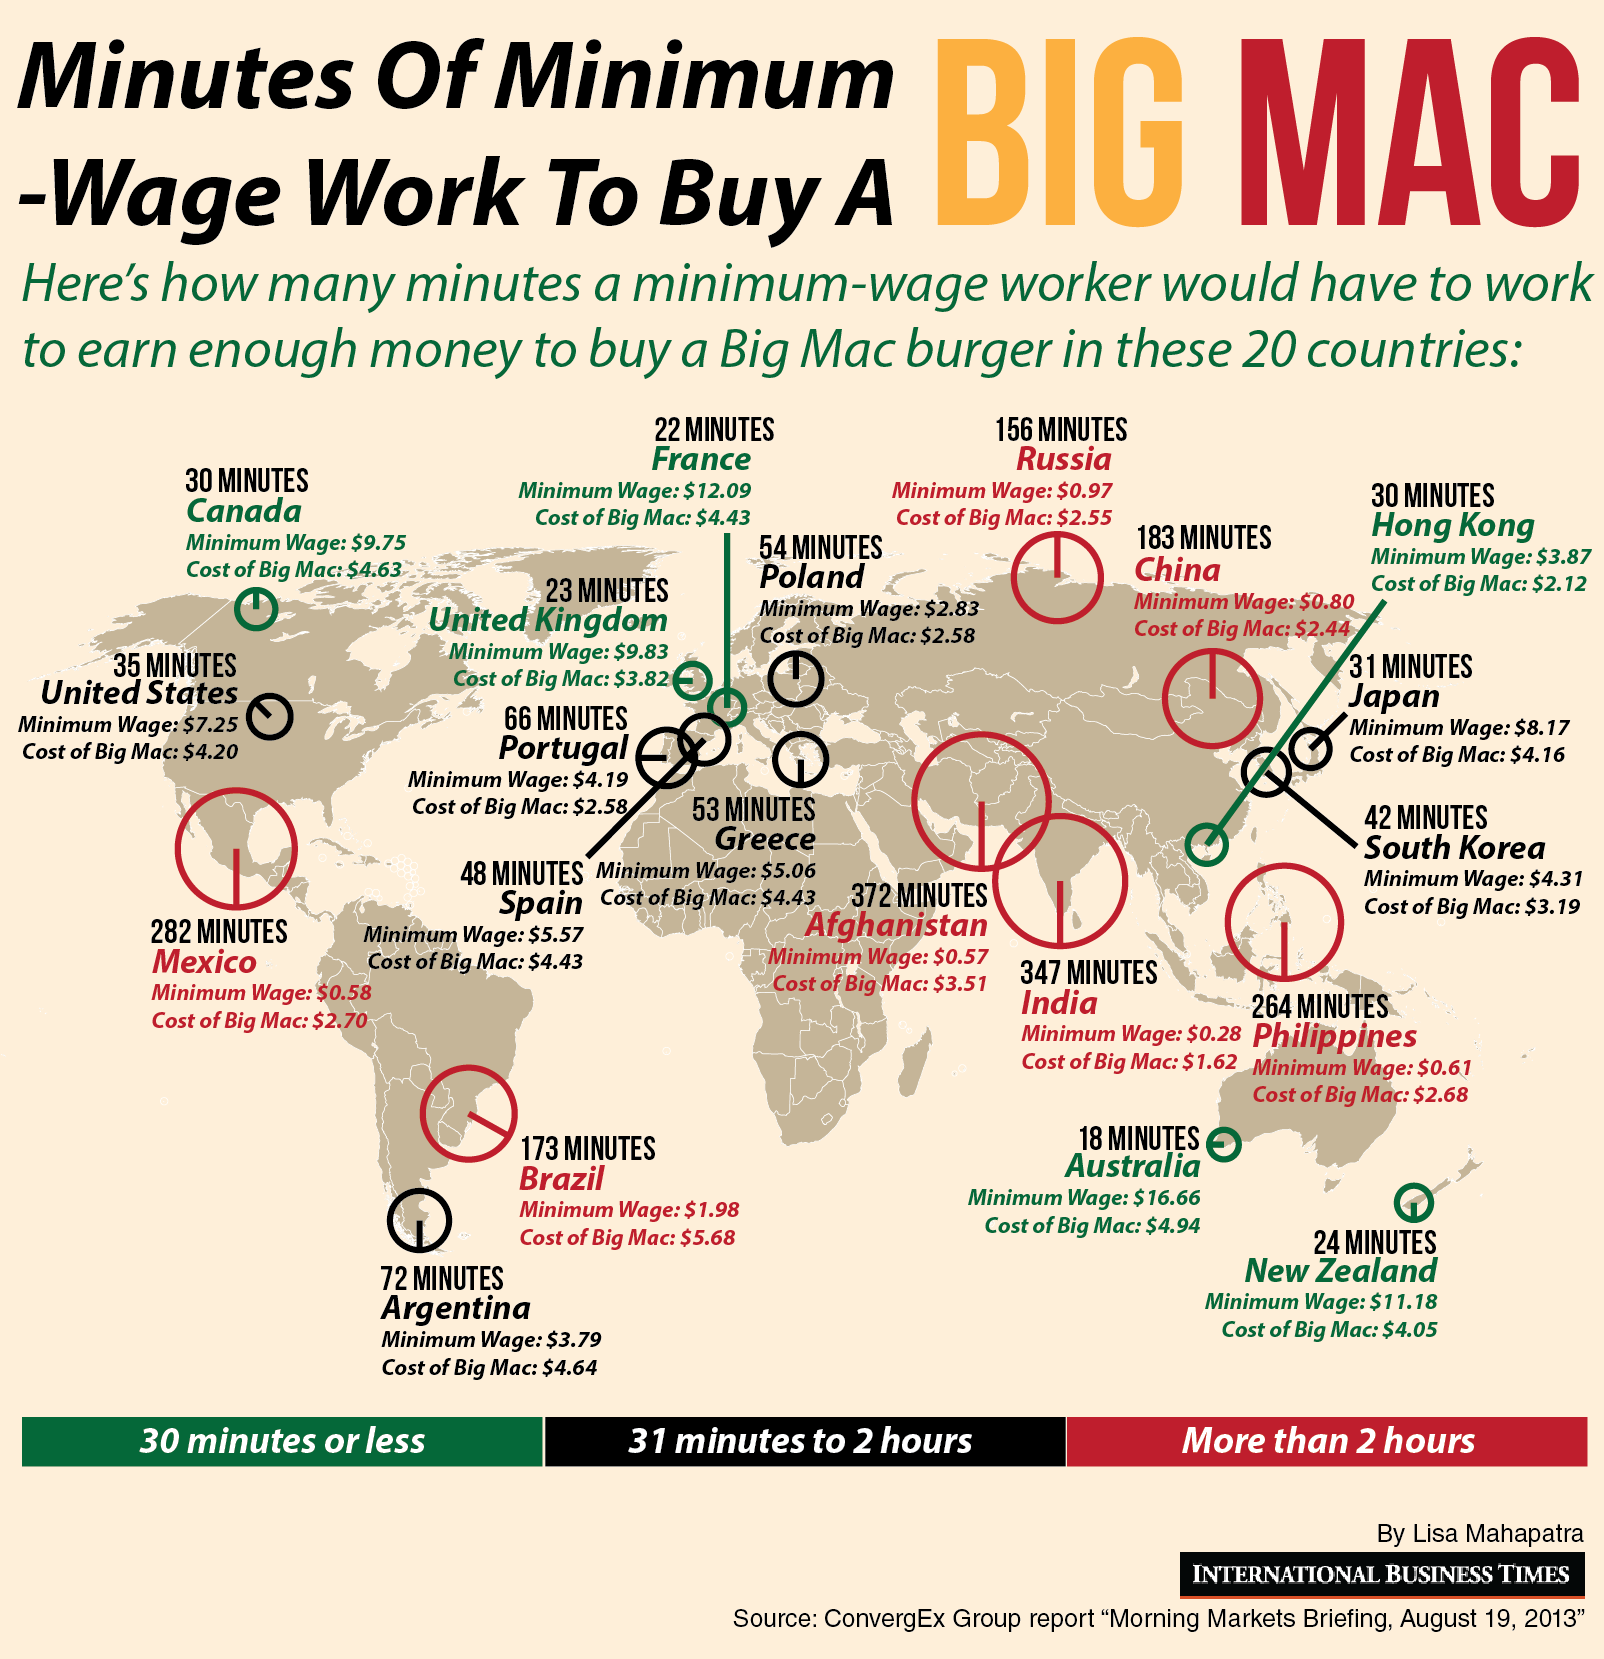
minutes of work for a big macUsing the criteria of the Big Mac Index developed by The Economist in 1986 as a way to measure if currencies are valued at the right level, the International Business Times created this visualization showing how many minutes a minimum-wage worker needs to work in order to buy a Big Mac burger.

As it turns out, a minimum-wage worker in Afghanistan needs to work 372 minutes (6.2 hours) in order to buy a Big Mac burger. In contrast, a minimum-wage worker in Australia needs to work only 18 minutes to buy a Big Mac burger.

Source: International Business Times: Minutes Of Minimum-Wage Work To Buy A Big Mac: 36 minutes in the US, 6 hours in Afghanistan


People Living with an HIV Diagnosis by U.S. County

people living with HIV diagnosis by countyOut of all the people in the United States who are HIV positive, up to one out of five are not aware of their condition. That’s just one of the interesting results highlighted by AIDSVu while preparing its most recent study.

The map above shows the number of people infected by the HIV virus per 100,000 people by county in the United States. The darkest red areas show the highest number of adults and adolescents with an HIV diagnose, 386 or more per 100,000 population. These numbers are concentrated along the East coast and Southern parts of the United States.

Source: AIDSVu: Persons Living with an HIV Diagnosis, 2010


Cannabis Consumption by Country

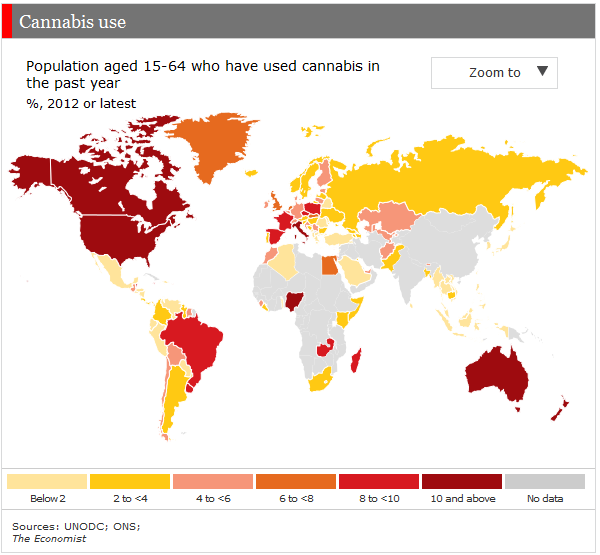
use of cannabis worldwideUruguay is on its way to legalize the production and consumption of cannabis, only waiting for the senate to pass the new bill. According to The Economist, more than 8% of Uruguay’s population ages 15 to 64 smoked cannabis in 2011, a higher percentage than in previous years.

Consumption of cannabis has also increased worldwide. Countries with the highest levels of consumption of cannabis in 2012, 10% or more of the population, include Italy, Nigeria, Australia, the United States, and Canada.


China at the Top of Renewable Energy Investment

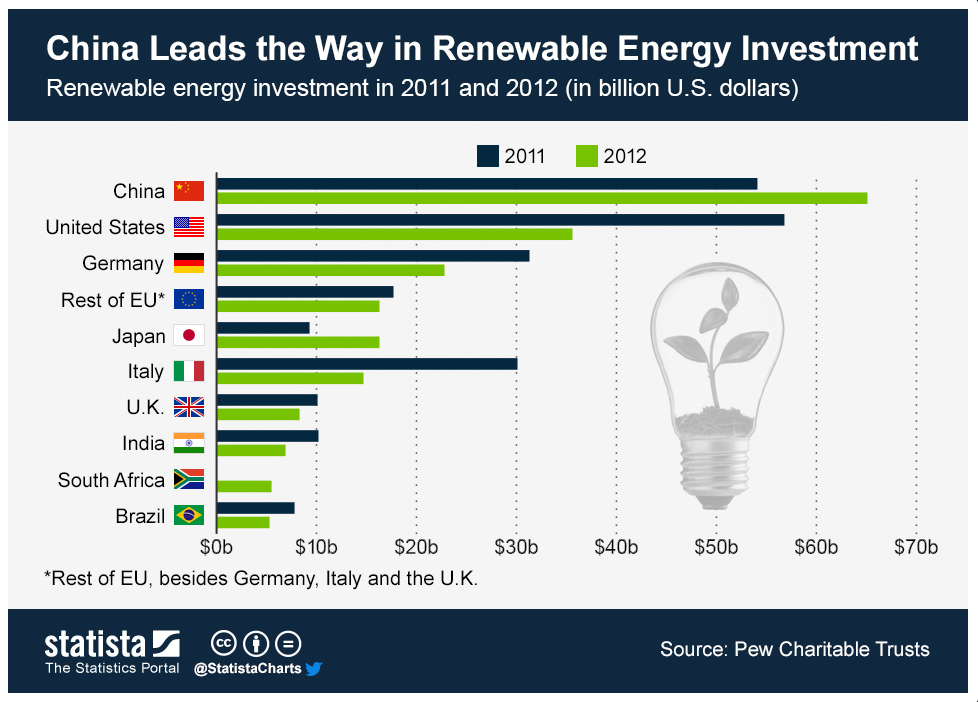
china leads energy investmentIn 2012 China’s investment in renewable energy surpassed the investment by the United States for the previous year and for the same year. In fact, China’s is ahead every other nation including Germany, Japan, and Italy.

China’s investment in renewable energy exceeded $60 billion for 2012, compared to an estimated $36 billion in the United States, and $23 billion in Germany for the same year.

Source: Statista: China Leads the Way in Renewable Energy Investment


Oil Production and Consumption by Country

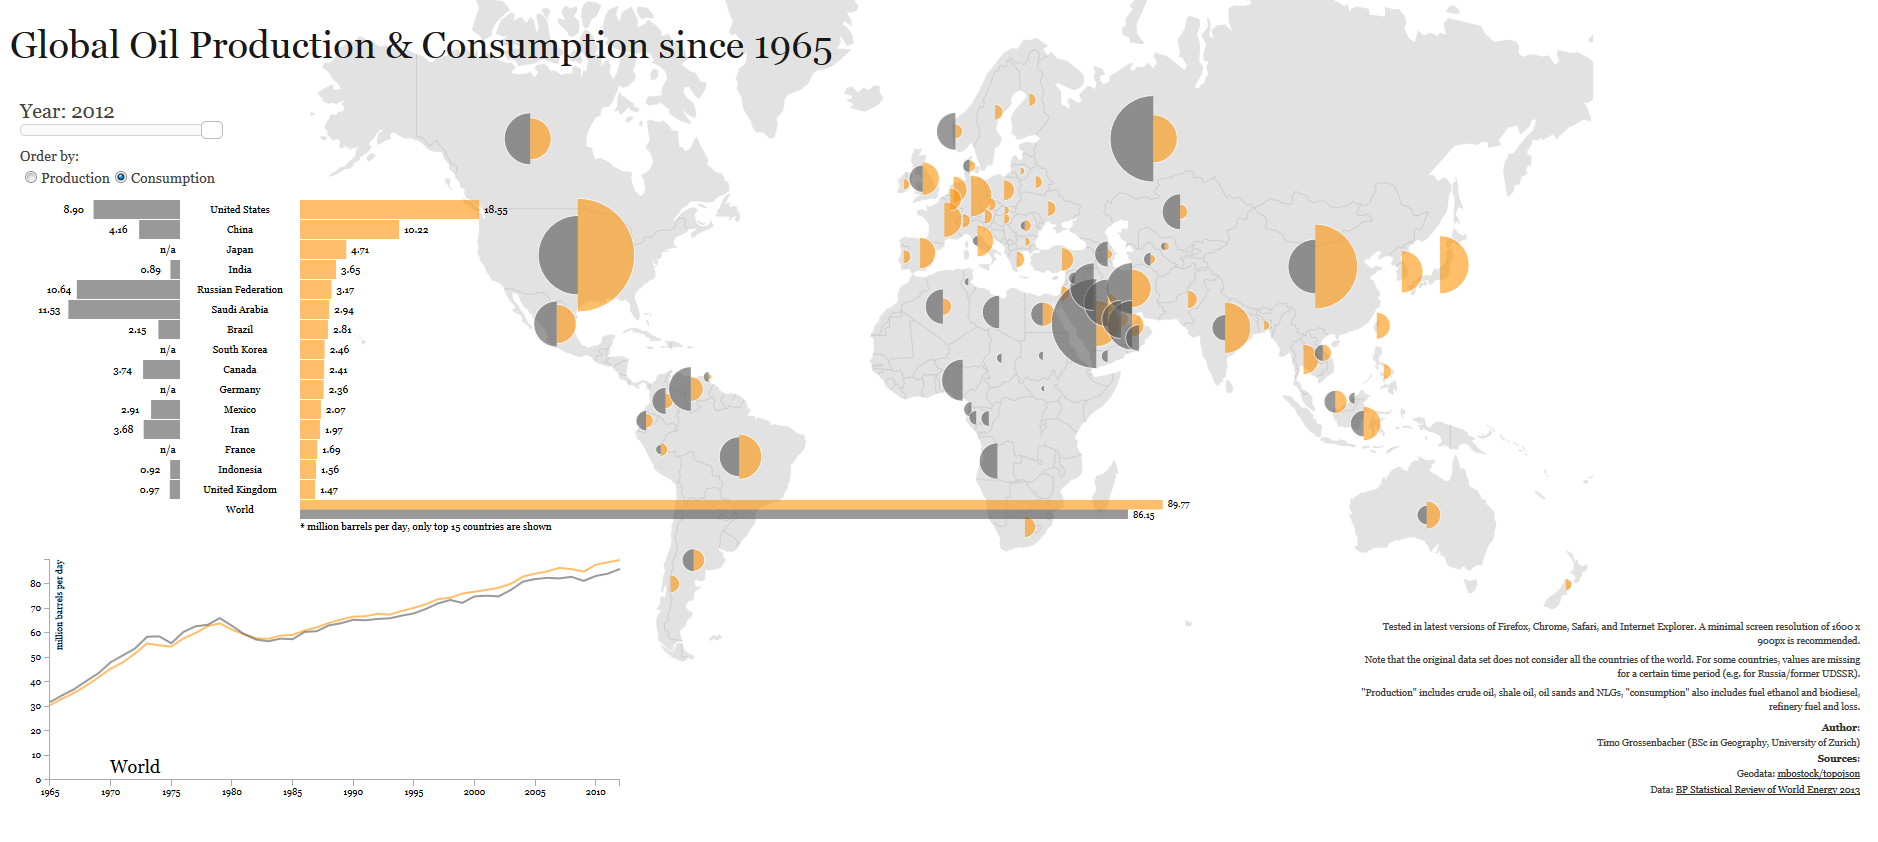
oil production and consumption since 1965When it comes to oil production and consumption, countries have a very close relationship of interdependence with each other. Some countries consume more oil than what they produce relying on imports to satisfy their internal demand. Others, consume less than what they produce, being able to export oil to nations that need it.

Oil consumption (yellow) for the United States, for example, was larger than its production (grey) for 2012, 18.55 mb/d (million barrels per day) compared to 8.9 mb/d, importing more than double its production to satisfy the gap in internal demand. Other nations with oil consumption higher that oil production include China, Brazil, Australia, India, UK, and Indonesia.

In contrast, oil consumption for Saudi Arabia for 2012 is estimated at 2.94 mb/d, while its production reached 11.53 md/d, exporting its oil surplus to the rest of the world. Other nations whose oil production exceeds its oil consumption include Canada, Mexico, Venezuela, Norway, Russia, Kuwait, United Arab Emirates, and Qatar.

Source: Winston Smith Labs: Global Oil Production and Consumption since 1965 [Interactive Map/Graph]